Debugging Document Object Model (DOM) issues can be a daunting task for JavaScript developers, especially when dealing with dynamic web applications. Fortunately, understanding and diagnosing problems in the DOM can significantly improve your debugging skills and make your code more robust. In this article, we will explore several techniques and tools to help you effectively debug DOM issues.
Understanding the DOM
Before diving into debugging techniques, it's important to understand what the DOM is. The DOM is a programming interface for web documents, providing a structured representation of the document as a tree of objects. JavaScript can manipulate this structure to dynamically change the document’s content, structure, and style.
Common DOM Issues
There are several common issues that JavaScript developers face when working with the DOM, such as:
- Elements not appearing or not updating on the page.
- JavaScript errors related to undefined elements.
- Event listeners not firing as expected.
- Performance bottlenecks due to heavy DOM manipulation.
Using Browser DevTools
Most modern browsers come equipped with developer tools that can help you inspect and modify the DOM, debug JavaScript code, and monitor network activities. Here’s how you can leverage these tools:
Inspect Elements
Right-click on any element in your browser and select Inspect (or use the shortcut Ctrl + Shift + I on Windows/Linux, Cmd + Option + I on macOS) to view the Element panel. This panel lets you see the hierarchy and properties of the DOM, allowing you to examine their styles and attributes.
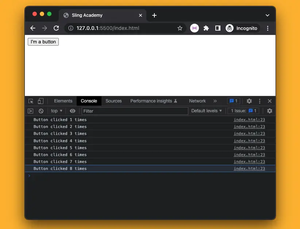
Console for Logging
The Console is an invaluable tool for logging messages or debugging information. You can log the values of your variables or DOM elements using:
console.log(document.getElementById('myElement'));This command logs the DOM element with the id 'myElement' to the console, allowing you to inspect its current state.
Breakpoints and Debuggers
JavaScript developers can use breakpoints to pause code execution and inspect the DOM's current state at specific points in your scripts:
- Add inline breakpoints in your source code files within the DevTools to stop execution when certain lines of code are reached.
- Use the JavaScript code
debugger;to programmatically set a breakpoint.
// Ensure a specific element exists
if (!document.getElementById('importantElement')) {
    debugger;  // Pause execution if the element does not exist
}
Analyzing the state directly on pause lets you understand what's happening with your JS and DOM at that instant.
Dealing with Event Listeners
Event delegation and proper event handling can sometimes be the underlying cause of problems. Inspecting and verifying event listeners can solve many issues. Within the Elements panel, you can view event listeners on specific elements and often need to:
element.addEventListener('click', function(event) {
    console.log('Clicked', event.target);
});
Here, monitor what specific element triggers the event to rectify any mismatch in event bubbling or element targeting.
Performance Considerations
Heavy DOM operations can degrade performance. It is advisable to:
- Minimize reflows and repaints by reducing DOM depth.
- Cache references to DOM elements that are used repeatedly.
Profile your application using the Performance panel within DevTools to track down inefficiencies.
Debugging DOM issues can seem challenging, but with the right approach and tools, you can master finding and fixing bugs efficiently. Practicing these tips and techniques will make you a more effective JavaScript developer and provide you with the skills to tackle even the most perplexing DOM problems.