Table of Contents
- Introduction
- Basic commands for viewing logs
- Viewing logs from a specific container
- Streaming logs
- Viewing logs from pods with multiple instances
- Viewing past logs of a crashed container
- Filtering logs with tail and since
- Advanced log queries with grep and jq
- Saving logs to a file
- Accessing logs using Kubernetes Dashboard
- Conclusion
Introduction
Understanding how to inspect logs of a Kubernetes pod is essential for troubleshooting and ensuring your application runs smoothly. In this tutorial, we’re going to cover the basics and move to more advanced examples of how to manually view logs of Kubernetes Pods.
Prerequisites
- Kubernetes cluster
- kubectl installed and configured
Basic commands for viewing logs
To start viewing logs for a running Pod, the kubectl logs command is your first stop:
kubectl logs <pod-name>Replace <pod-name> with the name of the Pod whose logs you want to view.
Output:
This is a log entry from the specified Pod ...
Another log entry ...
Viewing logs from a specific container
If your pod has multiple containers, you must specify which container’s logs you want:
kubectl logs <pod-name> -c <container-name>Output:
This is a log entry from the specified container in the Pod ...
Streaming logs
To tail logs in real-time, add the -f or –follow flag:
kubectl logs -f <pod-name>This command will continue to stream logs to your console until you cancel it with Ctrl+C.
Viewing logs from pods with multiple instances
For Deployments or ReplicaSets with multiple instances, you’ll need to specify the full pod name:
kubectl get pods
kubectl logs <pod-name-with-specific-hash>
Output for get pods:
NAME                          READY   STATUS   RESTARTS   AGE
example-pod-58c54f4dcd-9xlvq 1/1     Running  0          10m
Output for logs:
This is a log entry from one of the instances ...
Viewing past logs of a crashed container
If your container has crashed, use the –previous (or -p) flag to view the logs:
kubectl logs <pod-name> --previousOutput:
This is the last log entry before the crash ...
Filtering logs with tail and since
You can limit the number of lines to display with –tail:
kubectl logs <pod-name> --tail=20Or show logs from a certain period using –since:
kubectl logs <pod-name> --since=1hYou can also combine them:
kubectl logs <pod-name> --since=1h --tail=20Advanced log queries with grep and jq
To filter logs, you can pipe the output to grep:
kubectl logs <pod-name> | grep "ERROR"Or, if your logs are in JSON format, use jq:
kubectl logs <pod-name> | jq '. | select(.level == "error")'Output:
{"timestamp":"2023-03-26T14:12:34Z","level":"error","message":"Error occurred ..."}
Saving logs to a file
To save logs to a file for later inspection, simply redirect the output:
kubectl logs <pod-name> > pod-logs.txtAccessing logs using Kubernetes Dashboard
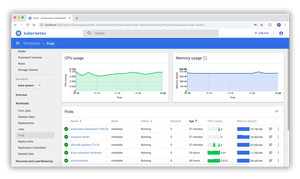
You can also view logs within the Kubernetes Dashboard:
- Navigate to the Pods section
- Click on the desired Pod
- Click on the Logs tab to view logs
Conclusion
Manually viewing the logs from Kubernetes pods allows you to gain insights into the behavior of your applications. End-to-end log analysis is a crucial debugging and monitoring technique that can help you in understanding performance and error-related issues within your cluster.