Introduction
Kubernetes and the Elastic Stack are two powerful technologies commonly used in modern DevOps environments. While Kubernetes is an open-source container orchestration platform that simplifies the deployment, scaling, and operations of application containers across clusters of hosts, the Elastic Stack (formerly known as ELK Stack) provides powerful tools for logging, searching, analyzing and visualizing data in real-time.
In this tutorial, we shall delve into integrating these two technologies to enhance the logging and analytical operations of your containers managed by Kubernetes with the seamless analytical power of the Elastic Stack.
Prerequisites
Before we start, you should have the following ready:
- A running Kubernetes cluster
- Kubectl command-line tool configured
- Basic understanding of Docker and Kubernetes concepts
- An installed Elastic Stack or access to Elastic Cloud
Step-by-Step Guide
Step 1: Setting Up Fluentd
To begin collecting logs from Kubernetes, we need a log shipper that is compatible with both Kubernetes and the Elastic Stack. Fluentd is a widely used open-source data collector for such purposes. Below is a basic Fluentd config file to start with:
<match kubernetes.**>
    @type elasticsearch
    host "elasticsearch-logging"
    port 9200
    logstash_format true
    include_tag_key true
    tag_key @log_name
    flush_interval 10s
</match>
To deploy Fluentd as a DaemonSet in your Kubernetes cluster, you can use the following Kubernetes manifest file:
apiVersion: apps/v1
kind: DaemonSet
metadata:
  name: fluentd-elasticsearch
  namespace: kube-system
spec:
  selector:
    matchLabels:
      k8s-app: fluentd-logging
  template:
    metadata:
      labels:
        k8s-app: fluentd-logging
    spec:
            containers:
                - name: fluentd-elasticsearch
                image: fluent/fluentd-kubernetes-daemonset:v1-debian-elasticsearch
                env:
                    - name: FLUENT_ELASTICSEARCH_HOST
                    value: "elasticsearch-logging"
                    - name: FLUENT_ELASTICSEARCH_PORT
                    value: "9200"
To apply this DaemonSet, use the command:
kubectl apply -f fluentd-daemonset.yaml
Step 2: Deploying Elasticsearch
If you do not have Elasticsearch running, you can deploy it to your Kubernetes cluster. Here is a simple deployment manifest for a basic Elasticsearch setup:
apiVersion: apps/v1
kind: Deployment
metadata:
  name: elasticsearch
  namespace: kube-system
spec:
  replicas: 1
  selector:
    matchLabels:
      app: elasticsearch
  template:
    metadata:
      labels:
        app: elasticsearch
    spec:
      containers:
      - name: elasticsearch
        image: docker.elastic.co/elasticsearch/elasticsearch:7.9.2
        ports:
        - containerPort: 9200
        - containerPort: 9300
        env:
        - name: discovery.type
        value: single-node
To create the Elasticsearch deployment:
kubectl apply -f elasticsearch-deployment.yaml
Step 3: Setting Up Kibana
Kibana is a part of the Elastic Stack that provides visualization capabilities. It should be configured to connect to the Elasticsearch deployed in the previous step. Use the following Kibana deployment configuration:
apiVersion: apps/v1
kind: Deployment
metadata:
  name: kibana
  namespace: kube-system
spec:
  replicas: 1
  selector:
    matchLabels:
      app: kibana
  template:
    metadata:
      labels:
        app: kibana
    spec:
      containers:
      - name: kibana
        image: docker.elastic.co/kibana/kibana:7.9.2
        ports:
        - containerPort: 5601
        env:
        - name: ELASTICSEARCH_HOSTS
        value: "http://elasticsearch:9200"
To deploy Kibana in your Kubernetes cluster:
kubectl apply -f kibana-deployment.yaml
Advanced Configuration
For a production environment, it’s essential to configure data persistence, handle multi-node Elasticsearch clusters, set up security, and perform fine-grained performance tuning. Let’s touch on each:
- Data Persistence: Attach persistent volumes to your Elasticsearch deployment to ensure data safety in case of pod failure.
- Multi-node Clusters: Scale your Elasticsearch deployment by increasing the replica count and configuring proper node discovery settings.
- Security: Secure your Elastic Stack components using Elasticsearch’s built-in security features or Kubernetes network policies.
- Performance Tuning: Customize JVM options, memory limits, and resource requests according to your cluster’s capabilities and expected workload.
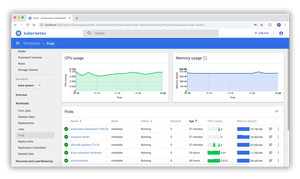
Visualizing Data with Kibana
Once Kibana is up and running, access the web interface and connect it to Elasticsearch. Use Kibana’s Discover feature to explore your Kubernetes logs. Here is how you might create an index pattern to view container logs:
GET /_cat/indices?v

# In Kibana
# Go to Management > Index Patterns > Create Index Pattern
# Enter "logstash-*" and follow the wizard
After setting up the index pattern, use Kibana visualizations and dashboards to monitor and analyze your Kubernetes clusters’ logging data.
Conclusion
In this tutorial, we learned how to combine Kubernetes with the Elastic Stack to create a robust logging and analysis solution. This setup can be an invaluable tool for monitoring and diagnosing issues in distributed systems and to help in making data-driven decisions in your IT infrastructure.