Introduction to Kubernetes Monitoring
Kubernetes is an open-source platform designed to automate deploying, scaling, and operating application containers. While Kubernetes offers its own monitoring tools like cAdvisor for container insights and metrics-server for resource usage, advanced monitoring requires integration with external systems like Prometheus and Grafana.
Monitoring is a critical aspect of maintaining the reliability, availability, and performance of Kubernetes clusters and applications. In this tutorial, we will explore how to use Prometheus accompanied by Grafana to set up a monitoring solution for your Kubernetes workloads.
What are Prometheus and Grafana?
Prometheus is an open-source system monitoring and alerting toolkit originally built at SoundCloud. Prometheus is specifically designed for reliability, offering a variety of features that make it ideal for monitoring Kubernetes clusters, such as:
- Multidimensional data model with time series data identified by metric name and key/value pairs
- Flexible query language, PromQL, to leverage this dimensionality
- No reliance on distributed storage; single server nodes are autonomous
- Time series collection happens via a pull model over HTTP
- Pushing time series is supported via an intermediary gateway
- Targets are discovered via service discovery or static configuration
- Multiple modes of graphing and dashboarding support
Grafana is the leading open source software for time series analytics. It allows you to query, visualize, alert on, and understand your metrics no matter where they are stored. With Grafana, you can create, explore, and share dashboards to foster a data-driven culture.
Step-by-Step Instructions
Step 1: Install Prometheus Operator in Kubernetes
Deploying Prometheus Operator simplifies the deployment of Prometheus and related monitoring components. To install it, first set up Helm, a package manager for Kubernetes, and then use Helm to install the operator.
kubectl create namespace monitoring
helm repo add prometheus-community https://prometheus-community.github.io/helm-charts
helm repo update
helm install prometheus-operator prometheus-community/kube-prometheus-stack --namespace monitoring
Step 2: Configure Prometheus to Discover Targets
Prometheus discovers service endpoints based on pod annotations or ServiceMonitor resources. You can annotate your pods or create ServiceMonitor objects to tell Prometheus which services to monitor.
apiVersion: monitoring.coreos.com/v1
kind: ServiceMonitor
metadata:
  name: example-service
  namespace: monitoring
  labels:
    release: prometheus-operator
spec:
  selector:
    matchLabels:
      app: your-application
  endpoints:
  - port: web
Step 3: Launching Grafana for Dashboarding
Grafana comes installed with Prometheus Operator. Once Prometheus is collecting metrics, you can access Grafana with the following commands:
kubectl port-forward --namespace monitoring svc/prometheus-operator-grafana 3000
Navigate to http://localhost:3000 on your browser. Use ‘admin’ for both the username and password, or whatever credentials you’ve configured.
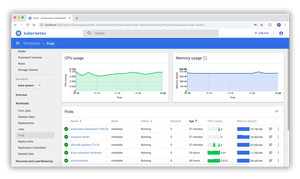
Step 4: Create Grafana Dashboards
Once you’ve accessed Grafana, you can import pre-existing dashboards or create your own. To import a dashboard, click + (plus sign) on the left menu, select ‘Import’, and then enter the dashboard ID or JSON.
{Paste your Grafana dashboard JSON here}Step 5: Configure Alerting in Prometheus
AlertManager comes integrated with Prometheus Operator. To configure alerts in Prometheus, create alerting rules that define conditions for sending alerts:
apiVersion: monitoring.coreos.com/v1
kind: PrometheusRule
metadata:
  name: example-alert
  namespace: monitoring
spec:
  groups:
  - name: example
    rules:
    - alert: HighRequestLatency
      expr: job:request_latency_seconds:mean5m{job="myjob"} > 0.5
      for: 10m
      labels:
        severity: page
      annotations:
        summary: High request latency
Advanced Integration: Custom Metrics and Adapters
For more advanced scenarios, you can integrate custom metrics using kube-state-metrics or by implementing the Kubernetes custom metrics API with adapters for systems such as Prometheus.
To set up kube-state-metrics:
kubectl apply -f https://github.com/kubernetes/kube-state-metrics/releases/download/v2.0.0/kube-state-metrics.yaml
Diagnostics and Troubleshooting
Metric-based monitoring is only the beginning. You’ll also want to ensure you’re ready to diagnose and troubleshoot. Tools such as kubectl, stern for log tailing, and kubetail for aggregating logs from multiple pods can be essential.
Conclusion
By integrating Prometheus and Grafana with Kubernetes, you now have powerful tools to monitor, alert, and visualize your cluster’s health and performance. This cohesive monitoring stack helps you maintain insight into operations and swiftly respond to issues before they impact your service.