Introduction
Kubernetes has become the de facto standard for container orchestration in the industry. One crucial component of any Kubernetes cluster is the Kubelet, which serves as the primary ‘node agent’ running on each Node. The Kubelet works by making sure that the containers are running as expected. Monitoring the performance of the Kubelet is essential to ensure the high availability and smooth functioning of the Kubernetes cluster.
This tutorial is designed to guide you through the process of monitoring the performance of Kubelet in a Kubernetes Cluster. The information provided ranges from basic to advanced, offering a comprehensive understanding of the steps involved.
Understanding Kubelet
Before diving into the monitoring aspect, it’s vital to understand what the Kubelet does. It is responsible for maintaining the state of a pod as declared in the PodSpec. The Kubelet takes a set of PodSpecs provided through various mechanisms and ensures that the containers described in these PodSpecs are running and healthy.
Basic Metrics to Monitor
Monitoring the performance of the Kubelet begins with identifying the necessary metrics. At a basic level, the following metrics should be monitored:
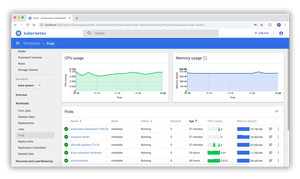
- CPU and Memory usage of the Kubelet process
- Kubelet uptime
- The number of running Pods
These metrics ensure that the Kubelet isn’t becoming a bottleneck and is maintaining the required level of performance.
Enabling Metrics in Kubelet
For monitoring purposes, Kubelet exposes various metrics via an HTTP server. Metrics are available by default. However, if you need to explicitly enable or configure metrics, you can modify the kubelet configuration:
--enable-server
Ensure that your Prometheus server is set up to scrape Kubelet metrics.
Using Prometheus for Monitoring
Prometheus is a powerful open-source monitoring solution that can be leveraged to keep tabs on the health and performance of your Kubelet. Here’s a basic setup for monitoring Kubelet using Prometheus:
Set up Prometheus
$ helm install stable/prometheus --name my-release --namespace monitoring
This will install Prometheus in your cluster within the ‘monitoring’ namespace.
Configure the Prometheus Server to Scrape Kubelet Metrics
Edit the Prometheus configuration file `prometheus.yml` and add the following scrape job under the `scrape_configs` section:
- job_name: 'kubelet'
  scheme: https
  tls_config:
    ca_file: /var/run/secrets/kubernetes.io/serviceaccount/ca.crt
    insecure_skip_verify: true
  bearer_token_file: /var/run/secrets/kubernetes.io/serviceaccount/token
  kubernetes_sd_configs:
  - role: node
  relabel_configs:
  - action: labelmap
    regex: __meta_kubernetes_node_label_(.+)
  - target_label: __address__
    replacement: kubernetes.default.svc:443
  - source_labels: [__meta_kubernetes_node_name]
    regex: (.+)
    target_label: __metrics_path__
    replacement: /api/v1/nodes/${1}/proxy/metrics
This configuration tells Prometheus to scrape the Kubelet metrics endpoint on each Kubernetes Node.
Verify the Metrics are Being Scraperd
After setting up Prometheus and configuring it to scrape Kubelet metrics, use the following command to see if the metrics are being collected:
$ kubectl get --raw /metrics
You should see a list of metrics that Prometheus is collecting from Kubelet.
Advanced Monitoring with cAdvisor
The Kubelet includes an integrated cAdvisor responsible for providing container metrics. These metrics can be scraped and used to get detailed information about resource usage.
Advanced Kubelet metrics that can be gathered include container-specific metrics such as:
- Filesystem usage
- CPU load averages
- Network statistics
These metrics provide a deeper insight into the resource usage of applications running on the Kubernetes cluster.
Querying Advanced Metrics
$ kubectl get --raw /apis/metrics.k8s.io/v1beta1/nodes
This command outputs detailed metrics in JSON format for all the nodes in the cluster collected by Kubelet and made available through the metrics server.
Using Grafana Dashboards
While Prometheus excels at data collection and alerting, Grafana is often used alongside Prometheus to visualize this data through well-constructed dashboards. Grafana provides the feature to create custom dashboards tailored to your needs; for example, a Kubelet monitoring dashboard could include:
- CPU and memory usage of each Kubelet
- Network IO
- Number of pods running
- Disk usage
Through the use of graphs, charts and alerts Grafana can enhance the observability of our Kubernetes clusters.
Integrating Alerts
When any of the metrics deviates beyond certain pre-configured thresholds, it’s crucial to get an immediate notification. Using Prometheus’ Alert Manager, you can configure rules to trigger alerts which can be sent via email, Slack, and various other channels.
Example of a Kubelet CPU Utilization Alert Rule:
- alert: HighKubeletCPU
  expr: instance:kubelet_cpu_usage:rate5m > 0.9
  for: 1m
  labels:
    severity: critical
  annotations:
    summary: High CPU usage of Kubelet on {{ $labels.instance }}
    description: Kubelet CPU usage is above 90%
This rule fires an alert when the Kubelet’s CPU usage exceeds 90% for more than a minute.
Conclusion
Monitoring Kubelet performance is key to maintaining a healthy Kubernetes cluster. From the basic CPU and memory utilization metrics to advanced network and disk usage statistics, setting up comprehensive monitoring with tools like Prometheus and Grafana will ensure that your clusters are highly available and performing optimally. Integrating alerts further assists in proactive cluster management, promptly addressing any potential issues that may arise.