Introduction
Monitoring is a critical aspect of Kubernetes administration, ensuring the health, performance, and reliability of both the cluster and the applications running on it. Node performance issues can lead to higher latency, reduced throughput, and ultimately, a poor user experience. By effectively monitoring nodes, you can proactively identify and solve these issues, maintaining a robust production environment.
Getting Started With Node Monitoring
To start with monitoring your Kubernetes nodes, you need a basic understanding of the metrics to watch for. Essential node-level metrics include CPU, memory, disk, and network usage. Tools like kubectl, Metrics Server, and Kubernetes Dashboard can help you extract these metrics. Here’s how you can get basic information about the nodes using kubectl:
$ kubectl get nodes
$ kubectl describe nodes
If you want to check resource usage metrics, deploy the Metrics Server:
$ kubectl apply -f https://github.com/kubernetes-sigs/metrics-server/releases/latest/download/components.yaml
Make sure the Metrics Server is running with:
$ kubectl get deployment metrics-server -n kube-system
You might have to edit the Metrics Server deployment to add the --kubelet-insecure-tls flag if you’re running into x509 certificate errors.
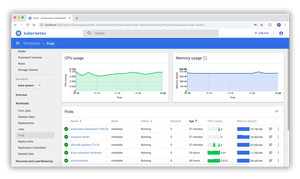
Using the Kubernetes Dashboard
The Kubernetes Dashboard gives you a GUI to monitor and manage your cluster resources. If not yet installed, you can set it up with:
$ kubectl apply -f https://raw.githubusercontent.com/kubernetes/dashboard/v2.0.0-beta8/aio/deploy/recommended.yaml
Access the Dashboard using:
$ kubectl proxy
Visit http://localhost:8001/api/v1/namespaces/kubernetes-dashboard/services/https:kubernetes-dashboard:/proxy/ in your browser, logging in with the token generated by:
$ kubectl -n kubernetes-dashboard create token admin-user
Using Prometheus and Grafana
For more extensive monitoring solutions, leverage the power of Prometheus and Grafana. Install Prometheus using Helm, a package manager for Kubernetes:
$ helm repo add prometheus-community https://prometheus-community.github.io/helm-charts
$ helm repo update
$ helm install prometheus prometheus-community/prometheus
For integration with Grafana, install Grafana similarly:
$ helm repo add grafana https://grafana.github.io/helm-charts
$ helm repo update
$ helm install grafana grafana/grafana
You can then configure Prometheus as the data source in Grafana and import or create dashboards to visualize the node metrics. Ensure to monitor the key indicators like CPU utilization, memory pressure, disk I/O, and network stats.
Node Exporter Daemons
To collect node-level metrics, you can deploy Node Exporter as a DaemonSet on each of your nodes. The Node Exporter provides a wide range of system metrics:
$ kubectl apply -f https://raw.githubusercontent.com/prometheus-operator/kube-prometheus/master/manifests/node-exporter-daemonset.yaml
Once applied, Prometheus should automatically discover the Node Exporter pods and pull metrics from them, provided the scrape configurations are correctly set.
Writing Alerts with Prometheus
Prometheus allows you to define comprehensive alert rules. Here’s an example of an alert for high memory usage:
groups:
- name: example
  rules:
  - alert: HighMemoryUsage
    expr: node_memory_Active_bytes / node_memory_MemTotal_bytes > 0.8
    for: 5m
    labels:
      severity: page
    annotations:
      summary: High Memory Usage
Create a alerts.yaml file including the above snippet and load it into Prometheus by updating the Prometheus ConfigurationMap.
Performance Analysis with kubectl-top
Apart from the third-party tools mentioned, kubectl-top is a simple yet effective way to view the current CPU and memory usage of nodes and pods. To get current usage for all the nodes:
$ kubectl top nodes
It is essential for spot checks but lacks historical data or alerting features which you can get from the Prometheus and Grafana stack.
Advanced Monitoring with Custom Metrics
Suppose you need to monitor specialized metrics or metrics from in-cluster services. In that case, you might implement custom metrics with Prometheus and make them available to Kubernetes HPA (Horizontal Pod Autoscaler) for autoscaling your services. This is more advanced, but thorough monitoring and scaling by combining different aspects of your system’s health.
Logging as a Part of Monitoring
Monitoring is incomplete without considering logging. Tools like Fluentd and Elasticsearch collect and interpret log data from all over your Kubernetes nodes and pods, giving you insights into what’s happening underneath the hood.
$ kubectl apply -f https://raw.githubusercontent.com/fluent/fluentd-kubernetes-daemonset/master/fluentd-daemonset-elasticsearch-rbac.yaml
Together, monitoring and logging give a comprehensive view of the node and cluster performance.
Conclusion
In conclusion, node health and performance monitoring in Kubernetes is a multi-faceted undertaking that involves tracking key metrics, setting up alerting thresholds, and visualizing data for quick feedback. Utilizing industry-standard tools such as Prometheus and Grafana, coupled with native utilities like kubectl and Metrics Server, ensures a robust monitoring setup. With these gained insights, Kubernetes administrators can keep clusters and applications operating optimally.