Introduction
NumPy, a foundational package for numerical computing in Python, offers a wide range of capabilities for handling arrays and more complex mathematical functions. Among its plethora of features, NumPy provides a module for generating random numbers, which is critical for simulations, random sampling, and various stochastic processes. In this tutorial, we will delve into the random.Generator.poisson() method, exploring its functionality through four detailed examples.
The Poisson distribution is a discrete probability distribution that expresses the probability of a given number of events happening in a fixed interval of time or space if these events occur with a known constant mean rate and independently of the time since the last event. The random.Generator.poisson() method in NumPy allows users to draw samples from this distribution.
Understanding the Basics
Before diving into the examples, it’s crucial to understand the syntax of the random.Generator.poisson() method:
random.Generator.poisson(lam=1.0, size=None)
Where lam represents the average rate (the lambda parameter of the Poisson distribution), and size specifies the output shape of the array containing the random samples.
Example 1: Basic Usage
In our first example, we’ll start with the basics by generating a single random number from a Poisson distribution with a lambda of 5:
import numpy as np

rng = np.random.default_rng()
number = rng.poisson(5)
print(number)
This will output a random integer that represents the number of events occurring, which is sampled from the Poisson distribution with lambda=5.
Example 2: Generating Multiple Samples
Next, we extend our exploration by generating an array of random numbers. Here, we aim to simulate the occurrence of a certain number of events over ten intervals:
import numpy as np

rng = np.random.default_rng()
array = rng.poisson(5, size=10)
print(array)
This code snippet will generate and print an array of ten integers, each representing the number of events occurring in a specific interval, given the same lambda rate of 5.
A possible output looks like this:
[5 6 7 3 1 3 7 4 1 3]Example 3: Visualizing the Distribution
With a sturdy understanding of generating random numbers from the Poisson distribution, let’s move towards visualizing these numbers to understand the distribution better. We’ll use matplotlib to create a histogram of 1000 samples:
import numpy as np
import matplotlib.pyplot as plt

rng = np.random.default_rng()
data = rng.poisson(5, size=1000)

plt.hist(data, bins=30, edgecolor='black')
plt.title('Poisson Distribution (lambda=5)')
plt.xlabel('Number of events')
plt.ylabel('Frequency')
plt.show()
Output (vary):
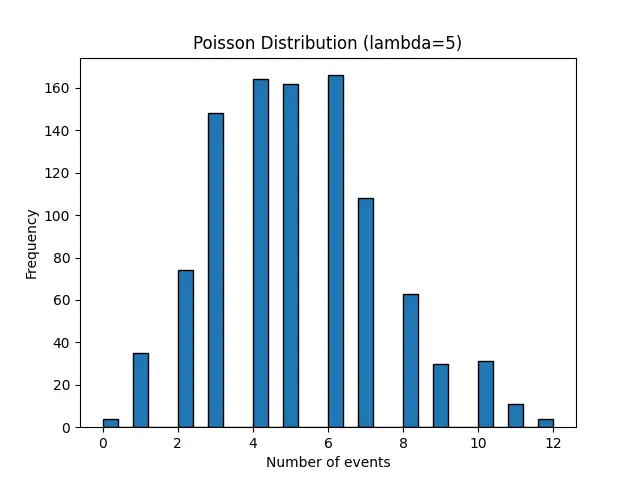
This visualization aids in comprehending the distribution’s shape and how the lambda parameter affects it. The graph we generate will likely show a characteristic shape of the Poisson distribution, centered around lambda, with frequency decreasing as the distance from lambda increases.
Example 4: Advanced Application
For our final example, we delve into a more advanced application by simulating a real-world scenario. Suppose we want to model the number of customer arrivals at a shop per hour, with an average of 10 customers per hour, over a period of 24 hours. This scenario can be modeled using the Poisson distribution:
import numpy as np

rng = np.random.default_rng(seed=42)
arrivals = rng.poisson(10, size=24)

for hour, count in enumerate(arrivals, start=1):
    print(f'Hour {hour}: {count} customers')
Output:
Hour 1: 13 customers
Hour 2: 6 customers
Hour 3: 9 customers
Hour 4: 11 customers
Hour 5: 9 customers
Hour 6: 10 customers
Hour 7: 13 customers
Hour 8: 13 customers
Hour 9: 13 customers
Hour 10: 10 customers
Hour 11: 6 customers
Hour 12: 8 customers
Hour 13: 10 customers
Hour 14: 6 customers
Hour 15: 7 customers
Hour 16: 9 customers
Hour 17: 12 customers
Hour 18: 9 customers
Hour 19: 12 customers
Hour 20: 7 customers
Hour 21: 13 customers
Hour 22: 10 customers
Hour 23: 6 customers
Hour 24: 12 customers
This advanced example simulates a practical application of the Poisson distribution, helping to illustrate the method’s utility in modeling and analysis.
Conclusion
Through these examples, ranging from basic to advanced usage, we have seen the versatility and power of the random.Generator.poisson() method in NumPy for generating random samples from a Poisson distribution. Understanding how to utilize this function allows for more robust simulations and analyses in a variety of scientific and engineering contexts.


