In this tutorial, we delve into the average() function from the cluster.hierarchy module of the SciPy library, exploring its fundamentals and offering practical examples to showcase its implementation in hierarchical clustering. SciPy is an open-source Python library used for scientific and technical computing. It provides many user-friendly and efficient numerical routines such as routines for numerical integration and optimization. Specifically, the cluster.hierarchy module allows for hierarchical clustering, which is an essential technique in data analysis and bioinformatics, among other fields.
Introduction to Hierarchical Clustering
Hierarchical clustering is a method of cluster analysis which seeks to build a hierarchy of clusters. Strategies for hierarchical clustering generally fall into two types:
- Agglomerative: This is a “bottom-up” approach where each observation starts in its own cluster, and pairs of clusters are merged as one moves up the hierarchy.
- Divisive: A “top-down” approach where all observations start in one cluster, and splits are performed recursively as one moves down the hierarchy.
Understanding the average() Method
The average() method in cluster.hierarchy is an agglomerative clustering technique that uses the average of distances between all observations in two clusters to determine the distance between those clusters. It’s particularly useful for identifying clusters with varying sizes and is considered more robust than simple linkage methods like single or complete linkage.
Importing Required Modules
import numpy as np
from scipy.cluster.hierarchy import dendrogram, linkage, average
from matplotlib import pyplot as plt
Basic Example: Two-Dimensional Data Clustering
Let’s start with a basic example using synthetically generated two-dimensional data to understand how the average linkage method works.
import numpy as np
from scipy.cluster.hierarchy import dendrogram, linkage, average
from matplotlib import pyplot as plt

np.random.seed(10)
X = np.random.multivariate_normal([10, 10], [[3, 1], [1, 4]], size=[100,])
Y = np.random.multivariate_normal([0, 20], [[3, 1], [1, 4]], size=[50,])

Z = np.vstack((X, Y))
result = average(Z)

dendrogram(result)
plt.title("Example 1 - SlingAcademy.com")
plt.xlabel("Sample index")
plt.ylabel("Distance")
plt.show()
Output:
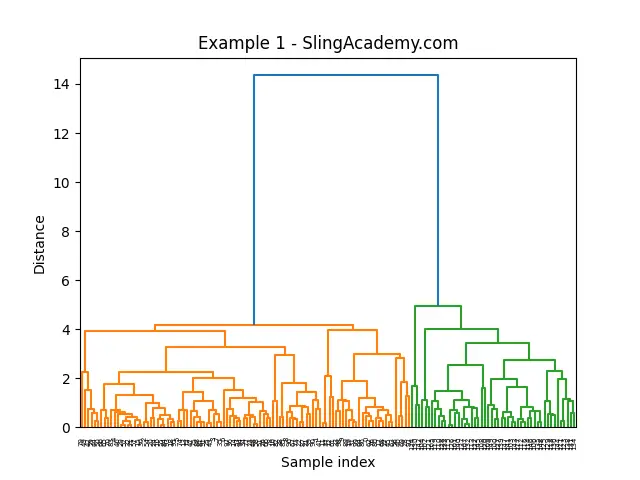
This code snippet generates two sets of points, clusters them using the average() method, and then plots the resulting dendrogram. In the plot, you can observe how the average linkage method operates.
Advanced Example: Clustering Iris Dataset
Moving on to a more complex example, let’s utilize the average() method to cluster the famous Iris dataset. This dataset contains measurements of 150 iris flowers from three different species. Our aim is to cluster these observations in a way that reflects their species classification based on their physical measurements.
import numpy as np
from scipy.cluster.hierarchy import dendrogram, linkage, average
from matplotlib import pyplot as plt
from sklearn.datasets import load_iris

data = load_iris()
X = data.data

result = average(X)

dendrogram(result, labels=data.target_names[data.target],
           truncate_mode='lastp', p=50, leaf_rotation=45.,
           leaf_font_size=12., show_contracted=True)
plt.title("Iris Dataset Hierarchical Clustering")
plt.xlabel("Species")
plt.ylabel("Distance")
plt.show()
Output:
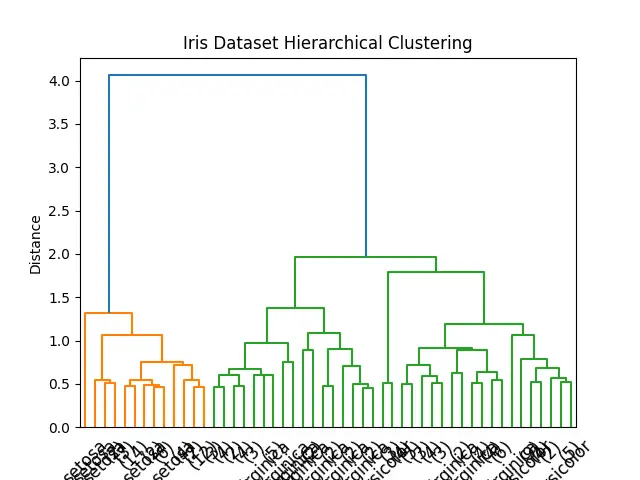
The output dendrogram reveals how each of the Iris species is grouped together, demonstrating the effectiveness of the average() method in real-world datasets.
Customizing Dendrogram
Dendrograms can be highly customizable. Modifying aspects such as leaf rotation, font size, and the truncation mode helps in making the dendrogram more readable, especially when dealing with larger datasets. This section briefly mentioned these options through examples in the previous sections.
Conclusion
The average() function from SciPy’s cluster.hierarchy offers a versatile strategy for hierarchical clustering. Through its implementation, we’ve explored both simple and complex data sets, demonstrating its applicability in diverse scenarios. Whether dealing with synthetic data for understanding or real-world data for analysis, the average() method provides a robust and efficient pathway to insights.


