Introduction
Understanding the structure within datasets is crucial for numerous scientific and engineering applications. Hierarchical clustering, with its intuitive tree-like representation of observations, serves as an instrumental analysis tool. The maxdists() function in SciPy’s cluster.hierarchy module emerges as a critical method for analyzing these structures by providing insight into cluster distances.
Syntax:
scipy.cluster.hierarchy.maxdists(Z)Parameters:
- Z : ndarray – A linkage matrix containing the hierarchical clustering information. The linkage matrix is usually the output of
linkagemethod from the same module.
Returns:
- maxdists : ndarray – An array of maximum distances for each cluster in the hierarchical clustering.
Getting Started with maxdists()
Before diving into examples, it’s important to grasp the prerequisites. Make sure you have SciPy installed and understand the basics of hierarchical clustering.
from scipy.cluster import hierarchy
import numpy as np

# Sample data array
X = np.array([[1, 2], [2, 3], [2, 5], [8, 7], [9, 8], [25, 30]])

# Perform hierarchical clustering
Z = hierarchy.linkage(X, 'ward')

# Using maxdists() to find the maximum distance
max_dists = hierarchy.maxdists(Z)
print(max_dists)
Output:
[ 1.41421356 1.41421356 2.94392029 12.39892468 41.82025028]This introductory example demonstrates how to use maxdists() to find the maximum distances within the clusters formed in a dataset.
Advanced Usage
Moving towards more complex scenarios, let’s integrate maxdists() with other functions for deeper analyses.
Example 2: Cross-referencing with dendrogram
import matplotlib.pyplot as plt
from scipy.cluster import hierarchy
import numpy as np

# Sample data array
X = np.array([[1, 2], [2, 3], [2, 5], [8, 7], [9, 8], [25, 30]])

# Perform hierarchical clustering
Z = hierarchy.linkage(X, 'ward')

# Using maxdists() to find the maximum distance
max_dists = hierarchy.maxdists(Z)


# Generating dendrogram
plt.figure(figsize=(10, 7))
plt.title('Hierarchical Clustering Dendrogram')
plt.xlabel('sample index')
plt.ylabel('distance')
hierarchy.dendrogram(Z)
max_d = max(max_dists)
plt.axhline(y=max_d, c='k')  # Here's where we use maxdists result
plt.show()
Output:
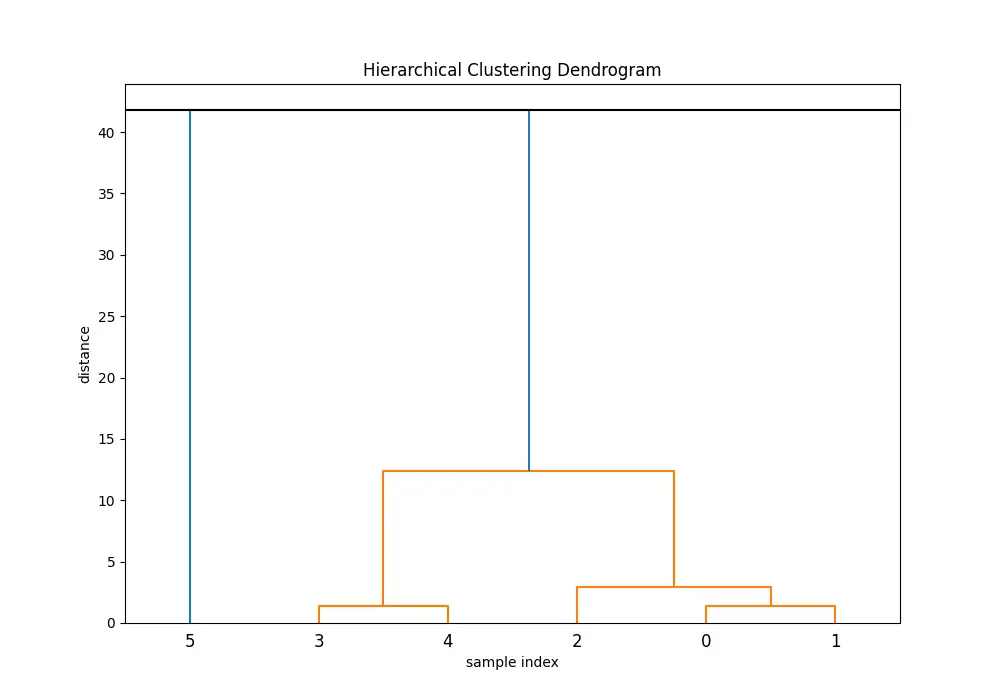
This example shows how the maxdists() output can enrich the dendrogram visualization by adding a horizontal line at the maximum distance, aiding in the decision-making process for cutting the dendrogram to form clusters.
Example 3: Analyzing Cluster Dispersion in Hierarchical Clustering with MaxDistances
Let’s consider a scenario where we perform hierarchical clustering on a dataset and then use maxdists() to analyze the maximum distances within the clusters formed. This example will involve generating a small dataset, performing hierarchical clustering, and then using maxdists().
import numpy as np
from scipy.cluster.hierarchy import linkage, dendrogram, maxdists
import matplotlib.pyplot as plt

# Generate a small dataset
np.random.seed(42)  # For reproducibility
data = np.random.multivariate_normal([0, 0], [[1, 0], [0, 1]], size=20)

# Perform hierarchical clustering
Z = linkage(data, method='ward')

# Calculate maximum distances within clusters
max_distances = maxdists(Z)

# Plot the dendrogram
plt.figure(figsize=(10, 5))
dendrogram(Z)
plt.title('Hierarchical Clustering Dendrogram')
plt.xlabel('Sample index')
plt.ylabel('Distance')

# Show maximum distances for each cluster
for i, md in enumerate(max_distances):
    plt.annotate(f'{md:.2f}', (i, md), xytext=(0, 5), textcoords='offset points', ha='center', color='red')

plt.show()

print("Maximum distances within clusters:", max_distances)
Output:
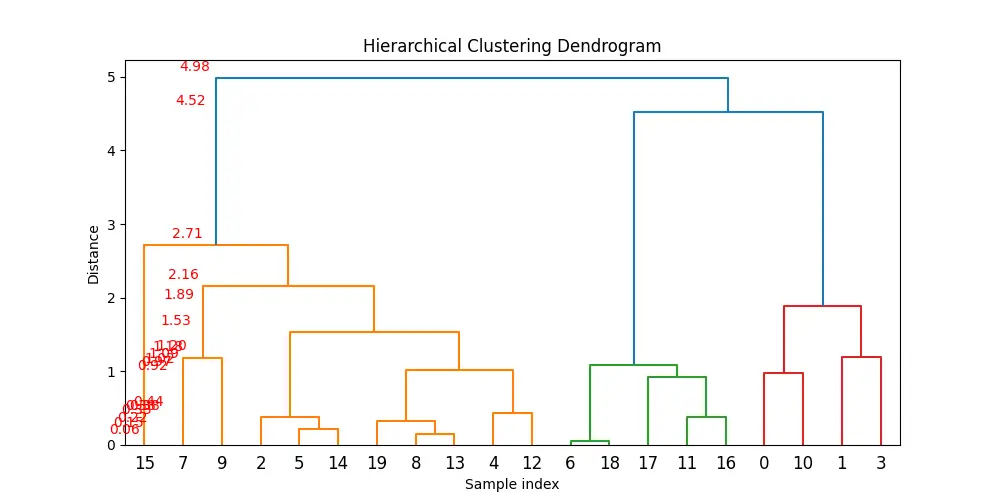
Maximum distances within clusters: [0.05698722 0.15121194 0.22162611 0.33183878 0.37587427 0.38232844
 0.4380892  0.91889981 0.97287853 1.01907869 1.09250637 1.17891599
 1.19944215 1.53364158 1.8863163  2.16453742 2.70959435 4.52091606
 4.97744242]
In this advanced example:
- We first generate a dataset of 20 samples with 2 features.
- We perform hierarchical clustering using the Ward method via the
linkagefunction. - We use
maxdists()to find the maximum distance within each cluster formed during the hierarchical clustering process. - We plot the dendrogram of the hierarchical clustering and annotate it with the maximum distances calculated for each cluster, providing visual insight into the dispersion within clusters.
This example demonstrates how to use maxdists() in conjunction with hierarchical clustering to analyze cluster properties in a dataset.
Conclusion
The maxdists() function is a potent tool in the hierarchical clustering arsenal, offering tangible metrics for understanding and manipulating the clustering process. Through practical examples ranging from beginner to advanced, this article has shown how it provides the analytical leverage to dissect and optimize clustering.


