Introduction
Understanding the fundamentals and applications of Ward’s clustering method can significantly enhance data analysis projects by enabling more structured data grouping. With the SciPy library, Python offers a straightforward yet powerful tool for employing this technique through the ward() function.
Ward’s method is a popular hierarchical clustering technique that seeks to minimize the variance within clusters. In this tutorial, we will explore how the ward() function from SciPy’s cluster.hierarchy module implements this method, and we will work through three examples of increasing complexity to illustrate its usage and versatility in data analysis.
Basic Example: Cluster a Small Dataset
Let’s start with a straightforward example to demonstrate how Ward’s method works with a small, two-dimensional dataset. This introduction will serve as a foundation for understanding more complex applications later on.
from scipy.cluster.hierarchy import ward, dendrogram
import matplotlib.pyplot as plt
import numpy as np

dataset = np.array([[1, 2], [2, 3], [2, 5], [8, 7], [8, 6], [9, 5]])

linkage_matrix = ward(dataset)
plt.figure(figsize=(10, 7))
dendrogram(linkage_matrix)
plt.title('Ward Method Dendrogram')
plt.show()
Output:
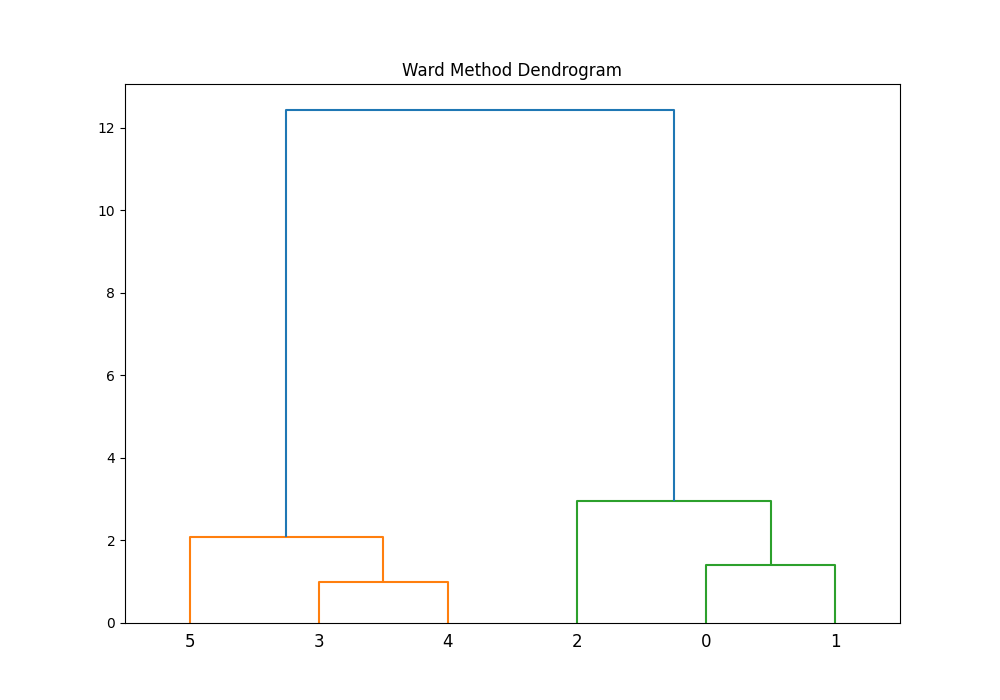
In this basic example, we clustered a small set of points based on their similarity. The resulting dendrogram visually represents the hierarchical nature of the clusters identified by Ward’s method, with the height of the branches indicating the distance (or dissimilarity) between clusters.
Intermediate Example: Using Distance Metrics for Clustering
Moving on to an intermediate example, let’s incorporate a different distance metric to show how it can affect the clustering outcome. While the ward() function itself does not directly allow the specification of a different distance metric, you can precompute distances and pass them to the function indirectly through other clustering functions available in SciPy.
from scipy.cluster.hierarchy import ward, dendrogram
import matplotlib.pyplot as plt
import numpy as np
from scipy.spatial.distance import pdist, squareform
from scipy.cluster.hierarchy import linkage

dataset_2 = np.random.rand(10, 2) # Generating a random dataset

# Calculate the pairwise distances between points
distances = pdist(dataset_2, 'euclidean')

# Perform hierarchical clustering using Ward's method
linkage_matrix_2 = linkage(distances, 'ward')
plt.figure(figsize=(10, 7))
dendrogram(linkage_matrix_2)
plt.title('Hierarchical Clustering with Euclidean Distance')
plt.show()
Output (may vary):
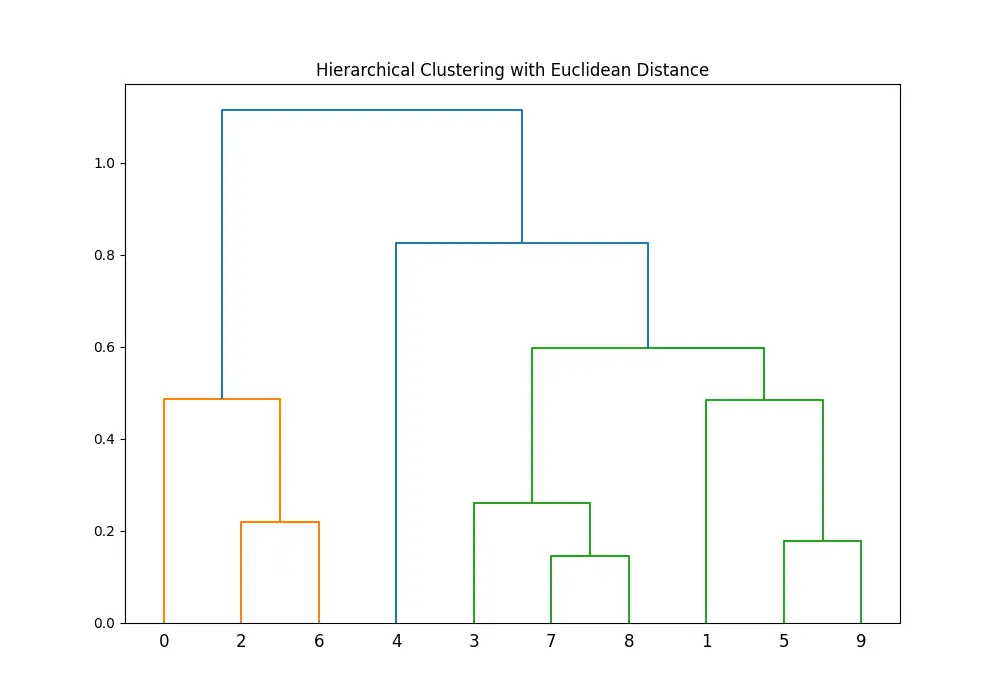
This approach allows for greater flexibility in preprocessing steps, letting you experiment with various distance metrics and preprocessing techniques before clustering.
Advanced Example: Integrating with Pandas and Real-world Data
For a more advanced example, we’ll apply Ward’s clustering method to a real-world dataset. We’ll use the Iris dataset, a classic dataset in the field of machine learning and statistics, showcasing how hierarchical clustering can reveal natural groupings within complex data. Further integrating with the Pandas library will facilitate data manipulation and analysis.
from scipy.cluster.hierarchy import ward, dendrogram
import matplotlib.pyplot as plt

from scipy.cluster.hierarchy import ward, dendrogram
from sklearn.datasets import load_iris
import pandas as pd

# Load the Iris dataset
iris = load_iris()
iris_df = pd.DataFrame(iris.data, columns=iris.feature_names)

# Perform Ward's clustering
linkage_matrix_3 = ward(iris_df)

# Plot the dendrogram
plt.figure(figsize=(10, 7))
dendrogram(linkage_matrix_3, labels=iris.target_names[iris.target])
plt.title('Iris Dataset Ward Clustering')
plt.show()
Output:
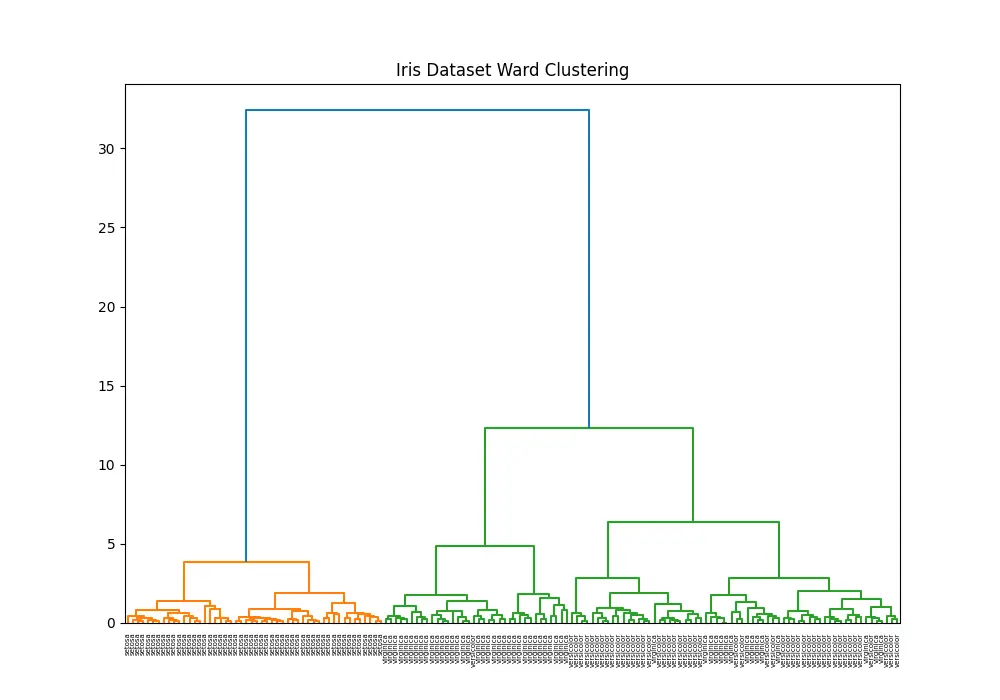
This example illustrates the process of applying the ward() function to a real-world dataset, demonstrating its utility in uncovering natural clusters and providing insights into data structure. Through this example, we see how combining SciPy’s hierarchical clustering capabilities with Pandas for data management creates a powerful toolset for data analysis.
Conclusion
The ward() function in SciPy’s cluster.hierarchy module is a versatile tool for hierarchical clustering, offering a means to deepen understanding of data through the lens of natural grouping. Starting from basic principles and moving towards more complex applications, we’ve seen how it can be applied to datasets of varying sizes and complexities, illustrating its broad utility in data science and analysis. Whether you’re embracing Ward’s method for academic research, industry projects, or exploratory data analysis, it provides a solid foundation for insightful data clustering.


