The datasets.electrocardiogram() function in SciPy provides access to a real-world dataset, specifically an electrocardiogram (ECG) signal. This function is part of the newer datasets module in SciPy, aimed at providing easy-to-use datasets for educational and demonstration purposes. This tutorial will guide you through using this function with various examples to help you understand how to work with real-world ECG data using SciPy. From basic usage to more advanced data manipulation and analysis, you’ll learn how to make the most out of the ECG data provided by SciPy.
Setting Up Your Environment
Before diving into the examples, ensure you have a working Python environment with NumPy, SciPy, Matplotlib, and Pooch (a dependency required for scipy.datasets) installed. If you need to install SciPy, you can do so using pip:
pip install numpy scipy matplotlib poochOnce you have SciPy installed, you’re ready to start exploring the datasets.electrocardiogram() function.
Basic Usage
The first step is to import the necessary module and load the ECG data:
from scipy import datasets
electrocardiogram = datasets.electrocardiogram()
print(electrocardiogram)
Output:
[-0.245 -0.215 -0.185 ... -0.405 -0.395 -0.385]The code prints an array containing the ECG signal. This data represents electrical activity recorded during one heart cycle, and you can plot this data using matplotlib to visualize the ECG wave:
import matplotlib.pyplot as plt
from scipy import datasets
electrocardiogram = datasets.electrocardiogram()

print(electrocardiogram)

# Plotting
plt.plot(electrocardiogram)
plt.title('Electrocardiogram (ECG) Signal')
plt.xlabel('Time')
plt.ylabel('Electrical activity')
plt.show()
Here’s the result:
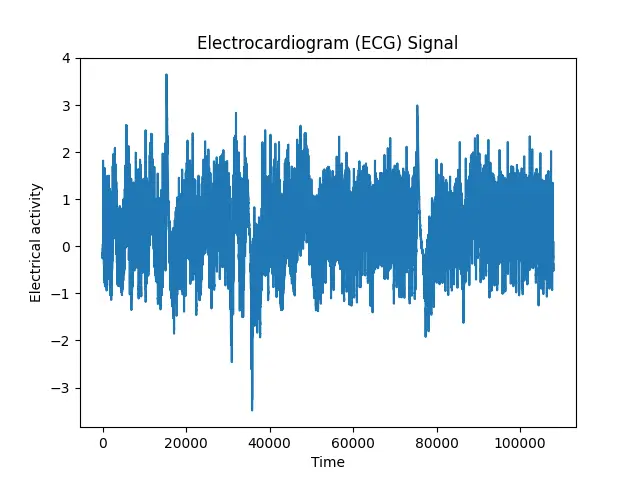
Now that you’ve seen the basic way to access and visualize the ECG data, let’s explore more advanced ways to work with this data.
Data Analysis
You can perform a variety of analyses on ECG data, from simple statistics to more complex signal processing tasks. Here’s how to get started with some basic analysis:
# Basic statistics
import numpy as np
from scipy import datasets

electrocardiogram = datasets.electrocardiogram()

mean = np.mean(electrocardiogram)
std_dev = np.std(electrocardiogram)
print(f'Mean: {mean}, Standard Deviation: {std_dev}')
Output:
Mean: -0.16510875, Standard Deviation: 0.5992473991177294These simple statistics can provide insight into the overall level of electrical activity and its variability over time. For more detailed analysis, you might want to look into signal processing techniques such as filtering and Fourier transforms.
Advanced Analysis
For those interested in diving deeper, analyzing the frequency components of an ECG signal can be particularly enlightening. Let’s use the Fast Fourier Transform (FFT) to analyze the frequency components:
from scipy.fft import fft
import numpy as np
from scipy import datasets
import matplotlib.pyplot as plt

electrocardiogram = datasets.electrocardiogram()


# Compute the FFT
ecg_fft = fft(electrocardiogram)
frequencies = np.fft.fftfreq(len(electrocardiogram))

# Plot the FFT
plt.plot(frequencies, np.abs(ecg_fft))
plt.title('Frequency Components of ECG Signal')
plt.xlabel('Frequency')
plt.ylabel('Amplitude')
plt.show()
Output:
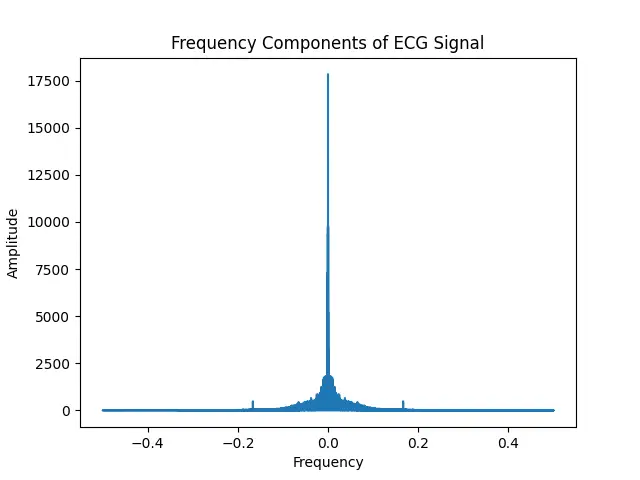
This analysis reveals the dominant frequencies within the ECG signal, which can be useful for identifying normal vs. abnormal heart rhythms.
Machine Learning with ECG Data
ECG data can also be a valuable resource for machine learning projects. For example, you could use the ECG data to train a model to differentiate between normal and abnormal heartbeats. This requires preprocessing the data, splitting it into training and testing sets, and choosing a suitable machine learning algorithm. While beyond the scope of this tutorial, such an application showcases the versatility of the ECG data available through SciPy’s datasets.electrocardiogram() function.
Conclusion
The datasets.electrocardiogram() function in SciPy offers a unique opportunity to work with real-world ECG data. Whether you’re exploring basic data visualization, conducting detailed signal analysis, or venturing into machine learning applications, this dataset provides a foundation to build upon. With the examples provided in this tutorial, you’re well-equipped to start your own explorations and contribute to the exciting field of biomedical signal processing.


