SciPy’s hierarchical clustering functionalities offer an impressive arsenal for data analysis and the median() method under cluster.hierarchy is specifically powerful for creating median linkage matrices. This tutorial will explore this function through four progressive examples, from the basics of how medians are computed in hierarchical clustering to more advanced applications, including data visualization techniques. By the end of this article, the reader will gain a solid understanding and practical application insight about the median() function in SciPy’s cluster.hierarchy.
Understanding the Basics
Before we dive into the examples, it’s crucial to understand what hierarchical clustering is and where the median() method fits within this context. Hierarchical clustering is a method of cluster analysis which seeks to build a hierarchy of clusters. The median() method is a way of calculating the distances between clusters using the median of distances in a previously merged cluster, providing an alternative linkage method to more common approaches like Ward’s or complete linkage.
Example 1: Basic Usage of median()
import scipy.cluster.hierarchy as sch
import numpy as np

# Generating random data
X = np.random.random((10, 2))
# Performing hierarchical clustering
Z = sch.linkage(X, method='median')
# Displaying the linkage matrix
print(Z)
This example illustrates the basic setup for performing hierarchical clustering using the median() method. The output, would be a linkage matrix representing the hierarchical clustering formed:
[[ 6.          8.          0.11702092  2.        ]
 [ 1.          9.          0.16177406  2.        ]
 [ 5.         10.          0.17802096  3.        ]
 [ 0.         12.          0.24590076  4.        ]
 [ 4.         13.          0.3089331   5.        ]
 [ 2.          3.          0.3393687   2.        ]
 [11.         15.          0.55272891  4.        ]
 [ 7.         16.          0.60435279  5.        ]
 [14.         17.          0.79363495 10.        ]]
Example 2: Visualizing Dendrograms
import scipy.cluster.hierarchy as sch
import numpy as np
import matplotlib.pyplot as plt

# Generating random data (as the previous example does)
X = np.random.random((10, 2))
# Performing hierarchical clustering
Z = sch.linkage(X, method='median')

# Creating a dendrogram
plt.figure()
sch.dendrogram(Z)
plt.title('Dendrogram for Hierarchical Clustering')
plt.xlabel('Sample index')
plt.ylabel('Distance')
plt.show()
Output (may vary):
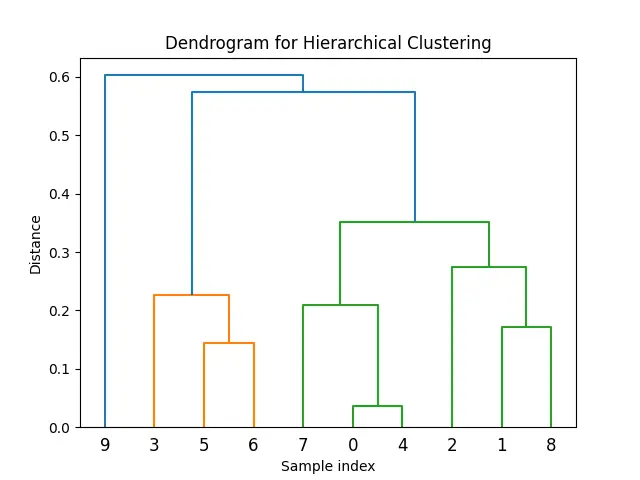
In this example, we go a step further by visualizing the hierarchical clustering represented by the Z matrix through a dendrogram. Dendrograms are tree-like diagrams that display the arrangements of the clusters produced by hierarchical clustering. This visualization not only brings clarity to the clustering process but also aids in determining the most appropriate number of clusters by observing the dendrogram.
Example 3: Combining Median Linkage with Heatmaps
import scipy.cluster.hierarchy as sch
import numpy as np
import seaborn as sns
import matplotlib.pyplot as plt

# Generating random data
X = np.random.random((10, 2))
# Performing hierarchical clustering
Z = sch.linkage(X, method='median')

# Generating a clustered heatmap
data = sns.clustermap(X, method='median')
plt.show()
Output (vary):
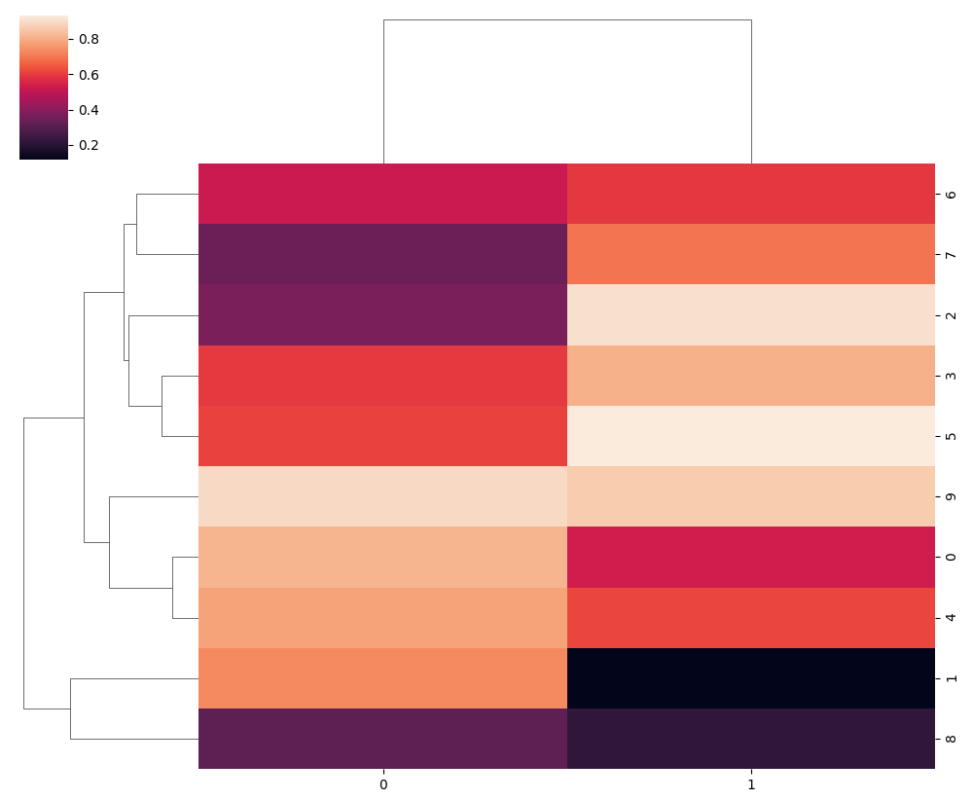
Expanding on our visual exploration, this example demonstrates how to use Seaborn’s clustermap() function, which combines hierarchical clustering with a heatmap. This method not only clusters the rows and columns based on similarity but also visually represents the original data, enhancing the interpretability of complex datasets.
Example 4: Case Study – Analyzing Iris Data
import scipy.cluster.hierarchy as sch
import matplotlib.pyplot as plt
from sklearn.datasets import load_iris
import pandas as pd

# Loading the Iris dataset
iris = load_iris()
iris_data = pd.DataFrame(iris.data, columns=iris.feature_names)

# Hierarchical clustering
Z = sch.linkage(iris_data, method='median')
# Creating a dendrogram
plt.figure()
sch.dendrogram(Z, labels=iris.target_names[iris.target])
plt.title('Iris Dataset Hierarchical Clustering')
plt.show()
Output:
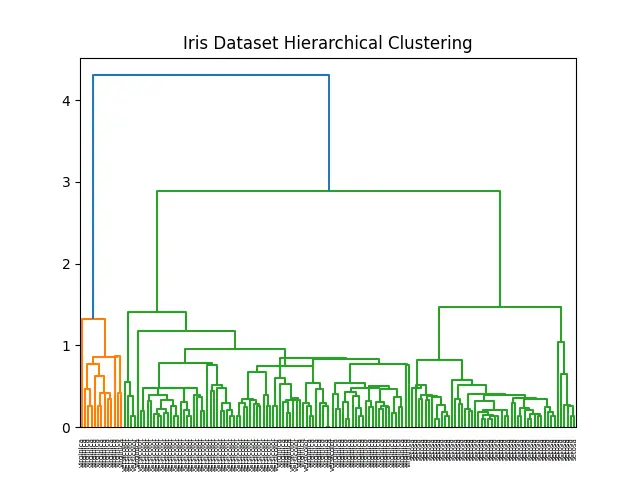
Our final example presents a practical application by performing hierarchical clustering on the famous Iris dataset. This case study highlights how the median() function can be employed to discover intrinsic groupings within real-world data. The use of a dendrogram here helps in visualizing and understanding the relationships between different Iris species based on their sepal and petal measurements.
Conclusion
The median() method in SciPy’s cluster.hierarchy offers a robust mechanism for hierarchical clustering, presenting a unique approach to grouping datasets based on medians. Through the examples provided, we explored the basic usage, visualization techniques, and practical applications, demonstrating the method’s flexibility and power. The median() function is an indispensable tool in the data scientist’s toolkit for uncovering hidden structures in complex datasets.


