Introduction
The Scipy library is a central tool for scientific computing in Python, offering modules for optimization, integration, interpolation, eigenvalue problems, algebraic equations, and more. One of its powerful submodules is cluster, specifically designed for vector quantization and clustering algorithms. In this tutorial, we dive deep into the whiten() function found within cluster.vq, explaining what it is, why it’s useful, and how to use it effectively with examples ranging from basic to advanced.
The whiten() function is crucial for normalizing a dataset before clustering. This process is vital as it ensures that each feature contributes equally to the distance computations, making the clustering process more effective and yielding more meaningful results.
Basic Concepts
Before jumping into code examples, let’s understand the basic concept behind the whiten() function. Normalization or standardization of data involves scaling the dataset in such a way that its variance (or standard deviation) is brought to 1. This is precisely what the whiten() function does. By doing so, it ensures that no single feature dominates the distance calculations simply because of its scale.
Basic Example
import numpy as np
from scipy.cluster.vq import whiten

data = np.array([[1, 30], [2, 20], [3, 10]])
normalized_data = whiten(data)
print(normalized_data)
Output:
[[1.22474487 3.67423461]
 [2.44948974 2.44948974]
 [3.67423461 1.22474487]]
This simple example demonstrates how to normalize a basic dataset using the whiten() function. The output shows the transformed dataset with variances normalized to 1.
Intermediate Example
import numpy as np
import matplotlib.pyplot as plt
from scipy.cluster.vq import whiten

# Generating some data
np.random.seed(0)
data = np.random.randn(100, 2) * [5, 1] + [20, 30]

# Normalizing the data
whitened_data = whiten(data)

# Plotting original vs whitened data
fig, axs = plt.subplots(1, 2, figsize=(10, 5))
axs[0].scatter(data[:, 0], data[:, 1])
axs[0].set_title('Original Data')
axs[1].scatter(whitened_data[:, 0], whitened_data[:, 1])
axs[1].set_title('Whitened Data')
plt.show()
Output:
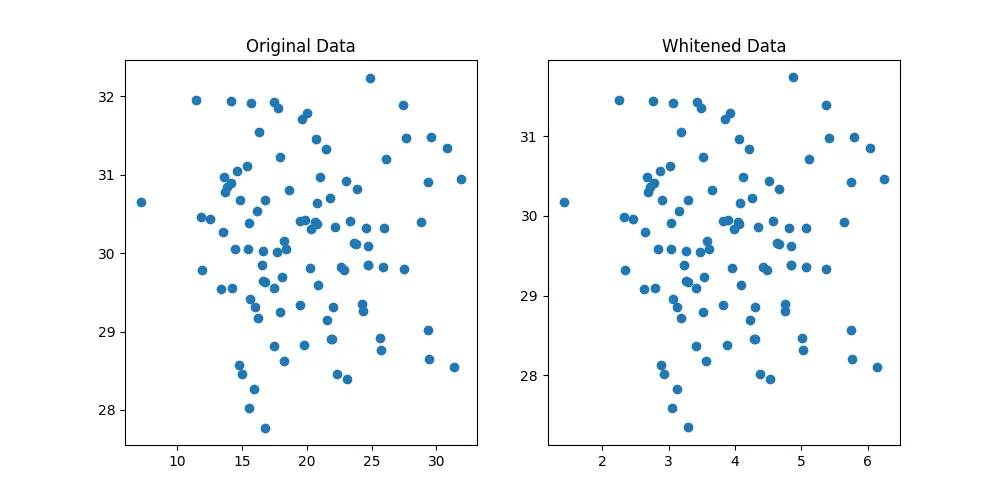
In this intermediate example, we see how whitening data can significantly alter its appearance, making clusters more identifiable in some cases. The figures generated by this code visually demonstrate the effectiveness of data normalization.
Advanced Example
import numpy as np
from scipy.cluster.vq import kmeans, whiten

# Preparing a more complex dataset
np.random.seed(42)
data = np.random.rand(500, 3) * 100

# Whitening the data
whitened_data = whiten(data)

# Performing k-means clustering on whitened data
book, _ = kmeans(whitened_data, 3)
print("Codebook vectors:\n", book)
Output:
Codebook vectors:
 [[1.97453981 1.49819202 0.58446406]
 [2.69038394 1.72751294 2.38222591]
 [0.7998001  1.67521761 2.10908212]]
This advanced example integrates the whiten() function with k-means clustering to perform clustering on a whitened dataset. Here, a “codebook” of vectors representing the cluster centers is obtained. This showcases the practical application of data whitening in preprocessing steps before clustering.
Conclusion
The whiten() function in Scipy’s cluster.vq submodule provides a straightforward approach to normalize the variance across different features in a dataset, making it indispensable for clustering and vector quantization tasks. Through the examples provided, we’ve seen how it can be applied to datasets of varying complexity, helping reveal inherent clusters by ensuring that each feature has the same weight in distance calculations. Understanding and effectively using this function is key to unlocking deeper insights in data clustering endeavors.


