What is Gumbel Distribution?
The Gumbel Distribution, often used in extreme value theory and hydrology, models the distribution of the maximum (or minimum) of a number of samples of various distributions. This makes it useful for predicting the occurrence of extreme events, like floods or significant market movements. It is characterized by two parameters: location and scale.
The distribution is skewed to the right, and its tail describes the decay rate of the tail of the distribution. The Gumbel distribution is instrumental in areas such as finance, insurance, and environmental engineering for risk assessment and disaster preparedness.
Introduction to random.Generator.gumbel() method
In this tutorial, we will delve deeply into the usage of NumPy’s random module, focusing on the Generator.gumbel() method. By understanding how to utilize this method effectively, you will expand your data science toolkit, enabling you to simulate data under a Gumbel distribution. This distribution is particularly useful in fields like hydrology, finance, and machine learning, especially for modeling extreme events. We will start with basic examples and gradually move towards more complex applications, illustrating the flexibility and power of the method.
Syntax:
generator.gumbel(loc=0.0, scale=1.0, size=None)
Parameters:
- loc: float or array_like of floats, optional. The location parameter of the distribution. Default is 0.
- scale: float or array_like of floats, optional. The scale parameter of the distribution. Default is 1. The scale parameter must be positive.
- size: int or tuple of ints, optional. Specifies the output shape. If the given shape is, for example,
(m, n, k), thenm * n * ksamples are drawn. If size isNone(default), a single value is returned iflocandscaleare both scalars. Otherwise,np.broadcast(loc, scale).sizesamples are drawn.
Returns:
- out: ndarray or scalar. Drawn samples from the parameterized Gumbel distribution.
Example 1: Basic Usage of Generator.gumbel()
import numpy as np

gen = np.random.default_rng()
sample = gen.gumbel(loc=0, scale=1, size=100)
print(sample[:5])
Output (vary):
[ 0.41059169 -0.00534434 1.78751119 -0.02013052 1.04646545]This example demonstrates creating an array of 100 samples from a Gumbel distribution with a default location (loc) of 0 and scale (scale) of 1. The first five samples are printed to show the data type generated.
Example 2: Visualizing the Gumbel Distribution
import matplotlib.pyplot as plt
import numpy as np

gen = np.random.default_rng()
samples = gen.gumbel(loc=0, scale=1, size=1000)
plt.hist(samples, bins=30, density=True)
plt.show()
Output (vary):
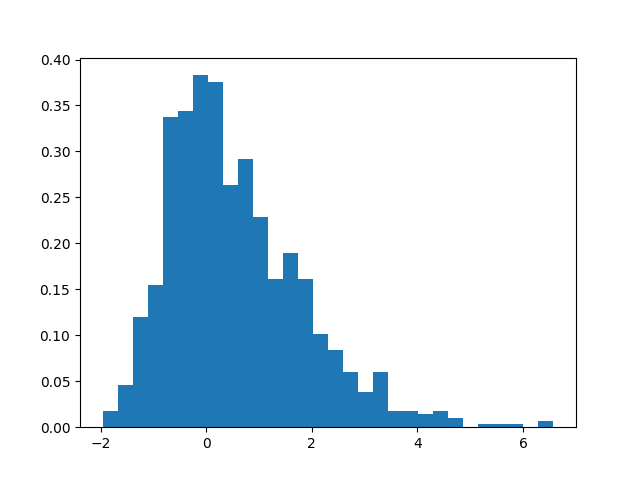
Here, we generate 1000 samples from a Gumbel distribution and use Matplotlib to plot a histogram. This helps visualize the shape of the data, illustrating how the Gumbel distribution can identify extreme values in a dataset.
Example 3: Simulating Real-World Scenarios
This section provides hypothetical scenarios where understanding and simulating Gumbel distribution through the Generator.gumbel() method could be particularly useful. We will simulate data for maximum annual temperatures at a particular location to assess the possible record-breaking highs in future years.
import numpy as np


gen = np.random.default_rng()

locations = ['Location A', 'Location B', 'Location C']
results = {}
for loc in locations:
    samples = gen.gumbel(loc=20, scale=2, size=50)
    avg_max_temp = np.mean(samples)
    results[loc] = avg_max_temp
print(results)
Output (vary):
{'Location A': 21.493441185634754, 'Location B': 20.860821582031246, 'Location C': 21.410022626346844}This advanced example simulates average maximum temperatures for different locations, providing a basis for analysis and predictions regarding weather patterns.
Example 4: Integrating with Machine Learning Models
Finally, we integrate the Generator.gumbel() method with machine-learning frameworks. Specifically, we generate a synthetic dataset to evaluate models or to provide additional robustness to real-world data. For instance, generative models, such as GANs (Generative Adversarial Networks), sometimes use the Gumbel distribution for generating discrete data.
from sklearn.preprocessing import StandardScaler
import numpy as np

gen = np.random.default_rng()

# Generating synthetic data
X = gen.gumbel(loc=0, scale=1, size=(1000, 10))
# Preprocess the data
scaler = StandardScaler()
X_scaled = scaler.fit_transform(X)

# Here you could proceed with using X_scaled in your model training
This section showcases the generation of a synthetic dataset using the Gumbel distribution. The data is then scaled using StandardScaler from the scikit-learn library, demonstrating how to integrate this process into a larger machine learning pipeline.
Conclusion
The Generator.gumbel() method in NumPy provides a powerful tool for simulating data under a Gumbel distribution, offering insights and solutions across various domains such as environmental science, finance, and artificial intelligence. Through the examples provided, it is clear that mastering this function can significantly enhance your data science and analytics projects.


