Introduction
Kubernetes is a powerful system that simplifies the process of deploying, scaling, and managing containerized applications. However, managing clusters and their resources directly through the Kubernetes API can be complex. The Kubernetes Dashboard offers a user-friendly web interface that allows you to manage and monitor applications running on your clusters and troubleshoot them as necessary.
In this guide, we’ll walk you through the basics of setting up and using the Kubernetes Dashboard, with practical examples to help you get the most out of this tool.
Prerequisites
Before we begin, make sure you have:
- A running Kubernetes cluster.
- kubectl command-line tool installed and configured to talk to your cluster.
- Administrative access to the cluster.
Setting Up the Kubernetes Dashboard
First, you’ll need to deploy the Kubernetes Dashboard to your cluster. You can do this using kubectl apply:
kubectl apply -f https://raw.githubusercontent.com/kubernetes/dashboard/v2.0.0/aio/deploy/recommended.yaml
Wait for the Dashboard to be deployed. Once it’s ready, you can verify that the Kubernetes Dashboard is running by checking the services in the kube-system namespace:
kubectl get svc -n kube-system
Accessing the Dashboard
To access the Dashboard, you’ll need to create a secure channel to your Kubernetes cluster. Run the following command:
kubectl proxy
This makes the dashboard accessible at:
http://localhost:8001/api/v1/namespaces/kubernetes-dashboard/services/https:kubernetes-dashboard:/proxy/
Authentication
When you first access the Kubernetes Dashboard, you’ll be prompted to log in with either a token or a kubeconfig file. For simplicity, we’ll use the token method.
Service Account Token
You can create a service account and grant it administrative privileges on your cluster by creating a ClusterRoleBinding:
apiVersion: v1
kind: ServiceAccount
metadata:
  name: admin-user
  namespace: kube-system
---
apiVersion: rbac.authorization.k8s.io/v1
kind: ClusterRoleBinding
metadata:
  name: admin-user
roleRef:
  apiGroup: rbac.authorization.k8s.io
  kind: ClusterRole
  name: cluster-admin
subjects:
- kind: ServiceAccount
  name: admin-user
  namespace: kube-system
Once the service account is created, retrieve the account’s token with this command:
kubectl -n kube-system describe secret $(kubectl -n kube-system get secret | grep admin-user | awk '{print $1}')
Copy the token and paste it into the Dashboard login screen to authenticate.
Deploying Applications
Using the Dashboard, you can deploy containerized applications onto your cluster. To do this, click on the ‘Deploy new application’ button and fill out the form, or enter YAML directly in the ‘CREATE A NEW RESOURCE’ tab.
apiVersion: v1
kind: Pod
metadata:
  name: my-nginx
spec:
  containers:
  - name: nginx
    image: nginx:latest
    ports:
    - containerPort: 80
Creating this pod through the Dashboard will spin up an Nginx web server instance. You can observe the status of the Pod and logs directly from the Dashboard.
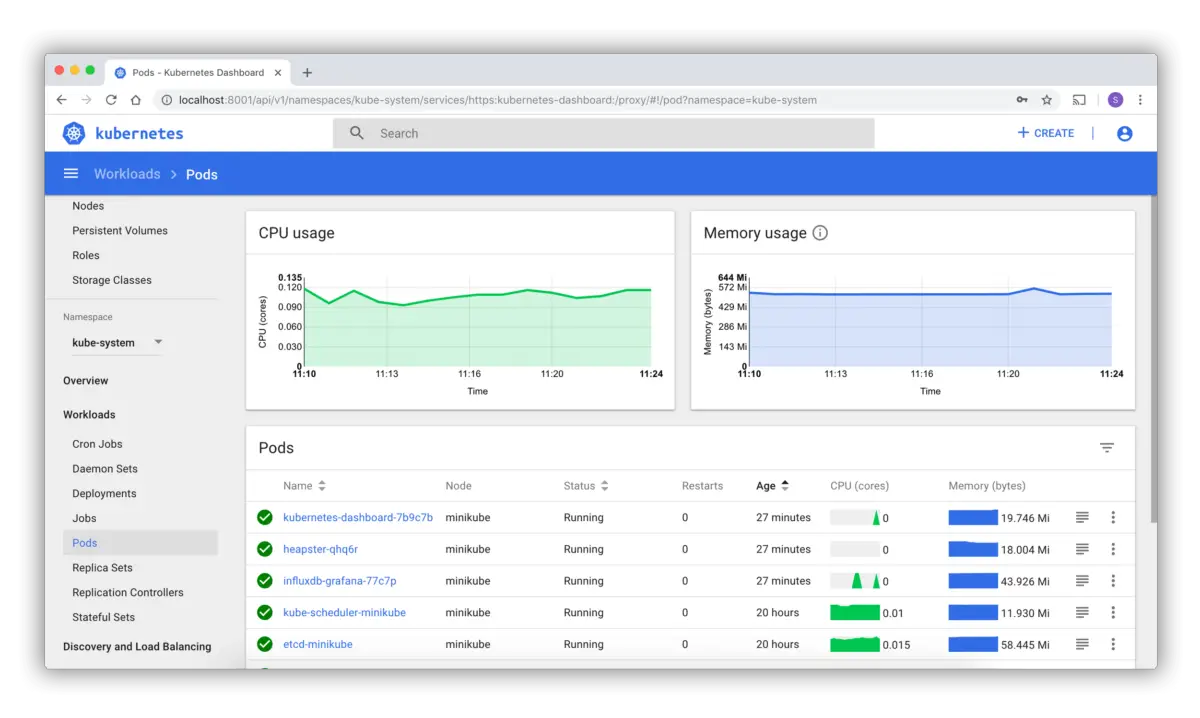
Monitoring Cluster Resources
The Dashboard also provides a wealth of information about the state of your cluster. You can monitor resources such as Pods, Deployments, and Services, viewing their metrics, health, and logs. This is useful for troubleshooting, as you can quickly access logs and error messages for specific deployments.
Advanced Usage
For more advanced users, the Dashboard offers more complex functionalities, such as managing Role-Based Access Control (RBAC) policies, scaling applications, or managing network policies.
You can scale deployments directly from the UI, adjust the number of replicas in real-time, and see the changes reflected immediately:
kubectl scale deployment my-nginx --replicas=3
If you’re familiar with Kubernetes, you can edit resources directly through Dashboard’s YAML editor, which provides the ability to change virtually any aspect of your deployment directly from the web interface.
Using Metrics Server
To visualize resources’ CPU and memory usage, you can install Metrics Server in your cluster:
kubectl apply -f https://github.com/kubernetes-sigs/metrics-server/releases/latest/download/components.yaml
Once installed, the Dashboard will display detailed resource usage for each pod and node, which helps in capacity planning and diagnosing performance issues.
Securing the Dashboard
Security is a critical aspect of managing and operating a Kubernetes cluster. It’s essential to limit access to the Dashboard to authorized users only. This means you might want to consider additional security measures like:
- Setting up a more restrictive RBAC policy.
- Securing the Kubernetes Dashboard with an ingress that supports HTTPS and authentication.
- Regularly reviewing audit logs for any unauthorized access attempts.
Conclusion
In conclusion, the Kubernetes Dashboard is an essential tool for managing Kubernetes clusters. It provides a visual interface for users to deploy applications, manage cluster resources, and monitor the health and performance of their systems. By integrating this guide’s practical examples, you can enhance your Kubernetes operations, promote efficiency, and ensure smooth application deployments.