Table of Contents
Introduction
Autoscaling in Kubernetes enables applications to adjust their resources dynamically based on load, ensuring efficient use of resources and consistent performance. Standard metrics like CPU and memory are commonly used for autoscaling; however, in some cases, you may need to scale based on custom metrics that better reflect your application’s workload. This tutorial will cover how to implement autoscaling based on custom metrics in Kubernetes.
Prerequisites
- A Kubernetes cluster
- kubectl, configured to communicate with your cluster
- Helm, for installing metrics-related tooling
- Metrics Server, for general resource metrics
- Custom Metrics API and an adapter for the specific metrics source (like Prometheus)
Step-by-Step Guide
Step 1: Setting Up the Metrics Server
The Metrics Server is a cluster-wide aggregator of resource usage data. To autoscale based on custom metrics, you first need to ensure that your cluster is also gathering standard metrics.
kubectl apply -f https://github.com/kubernetes-sigs/metrics-server/releases/latest/download/components.yamlStep 2: Installing Prometheus and the Prometheus Adapter
Prometheus is a popular monitoring tool that can serve as a source for custom metrics. The Prometheus Adapter allows these metrics to be accessed by Kubernetes’ Custom Metrics API.
helm repo add stable https://charts.helm.sh/stable
helm repo update
helm install prometheus stable/prometheus
helm install prometheus-adapter stable/prometheus-adapter --set prometheus.url=http://prometheus-server
Step 3: Creating Custom Metrics
With Prometheus and the Prometheus Adapter in place, you can now define custom metrics. Here’s an example of a Prometheus query that tracks the rate of HTTP requests:
- seriesQuery: 'http_requests_total{kubernetes_namespace="$1",kubernetes_pod_name="$2"}'
  resources:
    overrides:
      kubernetes_namespace: {resource: "namespace"}
      kubernetes_pod_name: {resource: "pod"}
  metricsQuery: "sum(rate(<<.Series>>{<<.LabelMatchers>>}[2m])) by (<<.GroupBy>>)"
Step 4: Deploying a Sample Application
Deploy a sample application that you want to autoscale based on custom metrics, such as an HTTP server that we can easily track requests for.
kubectl apply -f https://k8s.io/examples/application/deployment.yamlStep 5: Defining and Applying Horizontal Pod Autoscaler
Now it’s time to define a Horizontal Pod Autoscaler (HPA) configuration that references our custom metric:
apiVersion: autoscaling/v2beta2
code>: http_requests_total_per_second
statuses:
- type: External
  external:
    metric:
      name: http_requests_total_per_second
      selector:
        matchLabels:
          app: sample-application
    target:
      type: Value
      value: 10
Step 6: Observing the Autoscaler in Action
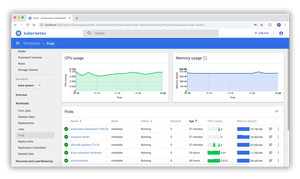
You can monitor the performance of the autoscaler:
kubectl get hpaThis output will show you the current number of replicas and whether new replicas are being added based on the specified metric.
Conclusion
Autoscaling based on custom metrics requires setup and understanding of Kubernetes’s metric systems, but can greatly enhance application responsiveness and resource management. After following this guide, you should now be able to implement autoscaling based on custom metrics unique to your application’s needs.
Remember to always validate your custom metrics and the availability of the metrics adapter for your sourcing tool, such as Prometheus. As your Kubernetes journey continues, consider exploring vertical pod autoscaling and cluster autoscaling for more complex scaling strategies.