NumPy, a fundamental package for scientific computing with Python, provides a comprehensive mathematical function library that includes random sampling from numerous statistical distributions, including the F-distribution. This tutorial takes a deep dive into how to generate samples from an F-distribution using NumPy. We’ll cover three different examples, escalating from basic sampling methods to more advanced techniques.
What is the F-distribution?
Before diving into the code examples, it’s essential to understand what the F-distribution is. The F-distribution, also known as the Snedecor’s F distribution or the Fisher-Snedecor distribution, is a continuous probability distribution that arises frequently in ANOVA (analysis of variance) when comparing the variances of different populations. It is characterized by two parameters: d1 and d2, which represent degrees of freedom of two chi-squared distributions.
Example 1: Basic Sampling
Our first example illustrates how to simply generate random samples from an F-distribution given degrees of freedom parameters d1 and d2.
import numpy as np

# Set the degrees of freedom
d1, d2 = 5, 2

# Generate 1000 random samples from the F-distribution
samples = np.random.f(d1, d2, 1000)

# Output the first 10 samples
print(samples[:10])
This will output an array of random samples, which can vary each time you run the code due to the nature of random sampling.
Example 2: Statistical Properties and Visualization
In the second example, we delve deeper into the statistical properties of the samples generated and how to visualize the distribution.
import numpy as np
import matplotlib.pyplot as plt
import seaborn as sns

# Set a random seed for reproducibility
np.random.seed(0)

# Using the same samples as the previous example
# Set the degrees of freedom
d1, d2 = 5, 2

# Generate 1000 random samples from the F-distribution
samples = np.random.f(d1, d2, 1000)

# Calculate and print mean and variance
mean = np.mean(samples)
variance = np.var(samples)
print(f"Mean: {mean}\nVariance: {variance}")

# Plot histogram
sns.histplot(samples, kde=True)
plt.xlabel('Value')
plt.ylabel('Frequency')
plt.title('Histogram of F-distribution samples')
plt.show()
Output:
Mean: 6.83833891282333
Variance: 1854.063488943291
You will also see this historgram:
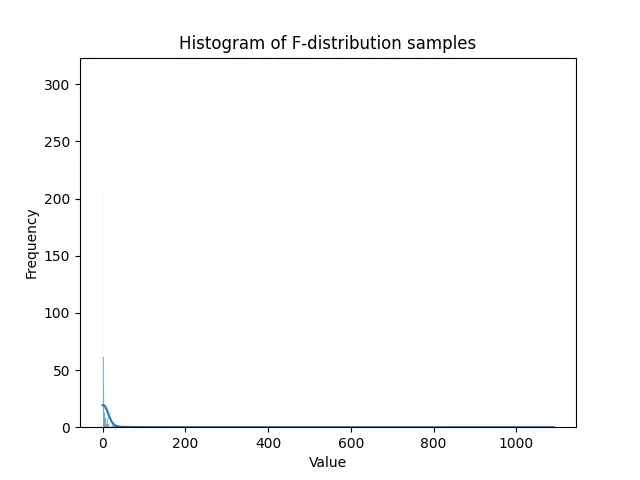
This example not only demonstrates how to calculate mean and variance, which are crucial to understanding the distribution’s shape, but also introduces data visualization with Seaborn and Matplotlib to observe the distribution of our samples visually.
Example 3: Advanced Techniques – Conditional Sampling
The third example explores more advanced sampling techniques, including conditional sampling from the F-distribution based on predefined criteria.
import numpy as np

# Advanced parameters
d1, d2 = 10, 5
threshold = 2.0

# Use a conditional loop to generate samples exceeding a threshold
conditional_samples = []
while len(conditional_samples) < 1000:
    sample = np.random.f(d1, d2, 1)
    if sample > threshold:
        conditional_samples.append(sample)

# This will generate 1000 samples greater than the threshold
print(f"Generated {len(conditional_samples)} samples with values > {threshold}.")
print(f"First 5 samples: {conditional_samples[:5]}")
Output (vary);
Generated 1000 samples with values > 2.0.
First 5 samples: [array([3.34633049]), array([4.45847757]), array([3.57212241]), array([2.3583774]), array([2.37835127])]
This advanced technique involves generating and evaluating samples individually, collecting those that meet our specific condition. This method is particularly useful for simulations or scenarios where certain sample characteristics are required.
Conclusion
Throughout this tutorial, we’ve explored how to use NumPy to generate random samples from an F-distribution, progressing from basic examples to more sophisticated sampling techniques. By understanding these methods, you can easily integrate statistical sampling into your data analysis or research projects, taking advantage of NumPy’s powerful computational abilities.


