Overview
This comprehensive tutorial is about the average() function in SciPy’s cluster.hierarchy module. This function plays a key role in hierarchical clustering, a method used to group similar objects into clusters. The average linkage method, in particular, measures the average distance between all pairs of objects in two clusters and uses this metric to decide whether to merge clusters during the hierarchical clustering process.
Throughout this tutorial, we will explore the average() function through several examples, starting with basic usages and gradually moving towards more advanced applications. This function not only forms the backbone of understanding hierarchical clustering but also serves as a foundation for complex data analysis and machine learning tasks.
What is Hierarchical Clustering?
Before diving into the specifics of the average() function, let’s understand the basics of hierarchical clustering. Hierarchical clustering is a technique used to build a hierarchy of clusters, where each observation starts in its own cluster, and pairs of clusters are merged as one moves up the hierarchy.
Getting Started with cluster.hierarchy.average()
To use the average() function, you first need to install SciPy if it’s not already installed on your system. You can do this using pip:
pip install scipyExample 1: Basic Average Linkage Clustering
Our first example will simply demonstrate how to perform basic hierarchical clustering using the average() linkage method:
import numpy as np
from scipy.cluster import hierarchy
import matplotlib.pyplot as plt

# Example 1: Basic Average Linkage Clustering
X = np.array([[1, 2], [3, 4], [5, 6], [7, 8]])
hierarchical_clustering = hierarchy.average(X)
plt.figure()
dendrogram = hierarchy.dendrogram(hierarchical_clustering)
plt.show()
Output:
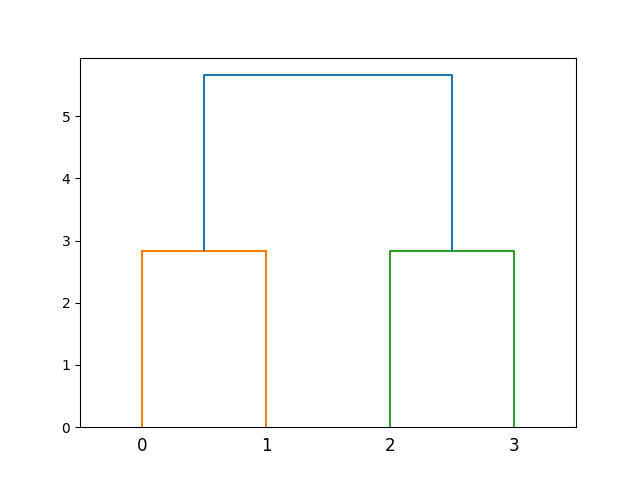
This code snippet creates a simple dataset of four points and applies hierarchical clustering using the average linkage method. The resulting dendrogram visually represents the clusters formed at each step of the process.
Working with Real-World Data
Example 2: Clustering Iris Dataset using Average Linkage
Moving towards more complex scenarios, let’s apply hierarchical clustering to a real-world dataset. For this example, we’ll use the Iris dataset, a popular dataset in the field of machine learning:
import numpy as np
from scipy.cluster import hierarchy
import matplotlib.pyplot as plt
from sklearn.datasets import load_iris

iris = load_iris()
X = iris.data
labels = iris.target

# Perform hierarchical clustering
Z = hierarchy.average(X)
plt.figure()
# Generate dendrogram with labels
hierarchy.dendrogram(Z, labels=labels.astype(str))
plt.show()
Output:
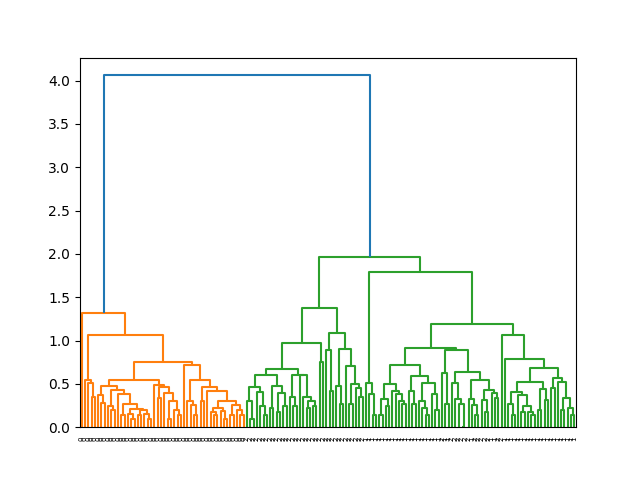
This example demonstrates how to cluster the Iris dataset using the average linkage method. The dendrogram labels help in identifying the clusters with their respective Iris species.
Advanced Usage: Custom Distance Metric
In more advanced scenarios, you might need to use a custom distance metric for clustering. The average() function allows for this flexibility. Below is an example of how to define and use a custom distance metric with the average() function.
Example 3: Using a Custom Distance Metri
import numpy as np
from scipy.cluster import hierarchy
import matplotlib.pyplot as plt
from scipy.spatial.distance import pdist, squareform

def custom_metric(x, y):
    return np.sqrt(np.sum((x - y) ** 2))

X = np.random.rand(10, 2)
# Calculate pairwise distances using custom metric
Y = pdist(X, custom_metric)
# Apply hierarchical clustering
Z = hierarchy.average(squareform(Y))
plt.figure()
hierarchy.dendrogram(Z)
plt.show()
Output:
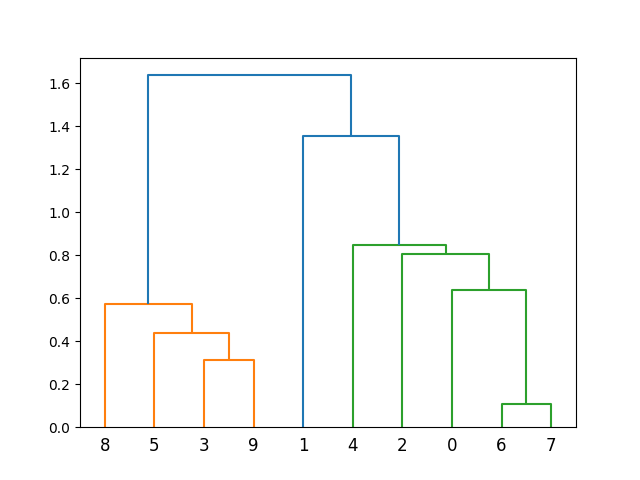
This example introduces a custom Euclidean distance metric and uses it for hierarchical clustering, showcasing the flexibility of the average() function in handling different distance measures.
Optimizing Clustering with the Elbow Method
When working with hierarchical clustering, deciding on the optimal number of clusters is crucial. You can employ the Elbow method in conjunction with the average() function to identify a good number of clusters.
Example 4: Identifying the Optimal Number of Clusters using the Elbow Method
import numpy as np
from scipy.cluster import hierarchy
import matplotlib.pyplot as plt
from scipy.spatial.distance import pdist

X = np.random.rand(20, 2)
Y = pdist(X)
Z = hierarchy.average(Y)
last = Z[-10:, 2]
last_rev = last[::-1]
idxs = np.arange(1, len(last) + 1)
plt.plot(idxs, last_rev)
plt.show()
Output (vary, due the randomness):
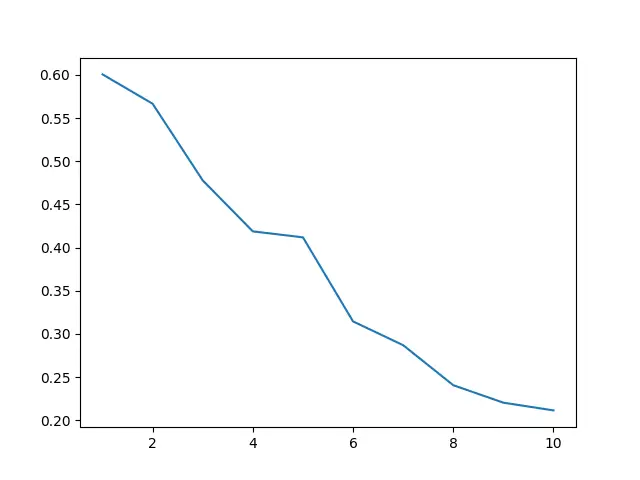
This code uses the Elbow method by plotting the last ten joined cluster’s distances. The “elbow” in the graph typically represents where the optimal number of clusters is.
Conclusion
The average() function in SciPy’s cluster.hierarchy module is a powerful tool for hierarchical clustering, offering versatility through custom distance metrics and helping in optimizing the number of clusters with methods like the Elbow method. Its applications, from simple datasets to complex real-world problems, underscore the breadth and depth of hierarchical clustering in data analysis and machine learning tasks.