The numpy.eye() function is an integral part of the NumPy library, aiding in the creation of identity matrices. This guide presents a comprehensive understanding of how to utilize the numpy.eye() function effectively, demonstrated through four increasingly complex examples. By the conclusion of this tutorial, you will be well-acquainted with not only the basics but also some advanced applications of numpy.eye().
Introduction to numpy.eye()
numpy.eye(N, M=None, k=0, dtype=float, order='C') generates an N x M matrix where all elements are 0 except for the k-th diagonal, which is all 1s. Primarily, it’s used to create identity matrices, which are pivotal in linear algebra. Now, let’s explore its parameters:
- N: Number of rows in the output.
- M (Optional): Number of columns. If not specified, M is assumed to be equal to N, resulting in a square matrix.
- k (Optional): Index of the diagonal. Default is 0. k>0 for diagonals above the main diagonal, and k<0 for diagonals below.
- dtype (Optional): Desired data-type for the matrix, float64 by default.
- order (Optional): Whether the output should be stored in row-major (C) or column-major (Fortran) order.
Example 1: Basic Identity Matrix
import numpy as np

# Create a 5x5 identity matrix
I = np.eye(5)
print(I)
Output:
[[1. 0. 0. 0. 0.]
 [0. 1. 0. 0. 0.]
 [0. 0. 1. 0. 0.]
 [0. 0. 0. 1. 0.]
 [0. 0. 0. 0. 1.]]
This example illustrates the simplest use of numpy.eye(), generating a standard 5×5 identity matrix. It serves as a foundational building block in linear algebra.
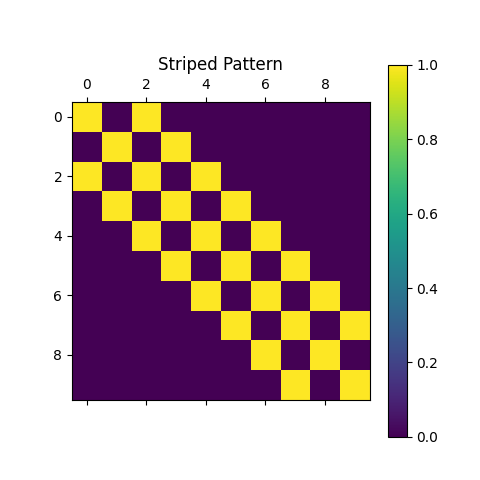
Example 2: Creating a Striped Pattern
This generates a matrix with diagonal stripes by adding identity matrices with different offsets.
import numpy as np
import matplotlib.pyplot as plt

n = 10
stripes = np.eye(n, k=0) + np.eye(n, k=2) + np.eye(n, k=-2)

plt.matshow(stripes)
plt.title("Striped Pattern")
plt.colorbar()
plt.show()
Output:
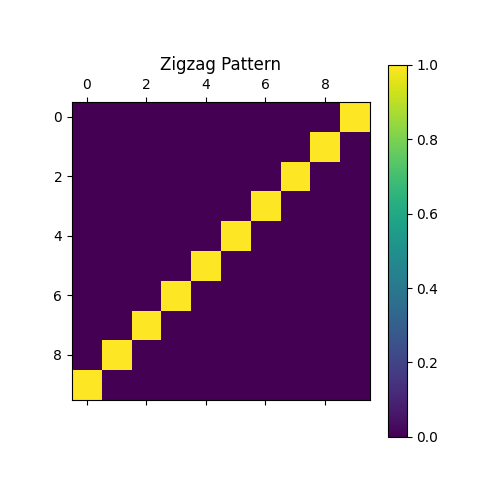
Example 3: Rotating Identity Matrix to Create a Zigzag Pattern
This example creates a zigzag pattern by reversing the columns of an identity matrix.
import numpy as np
import matplotlib.pyplot as plt

n = 10
zigzag = np.eye(n)[:, ::-1]

plt.matshow(zigzag)
plt.title("Zigzag Pattern")
plt.colorbar()
plt.show()
Output:
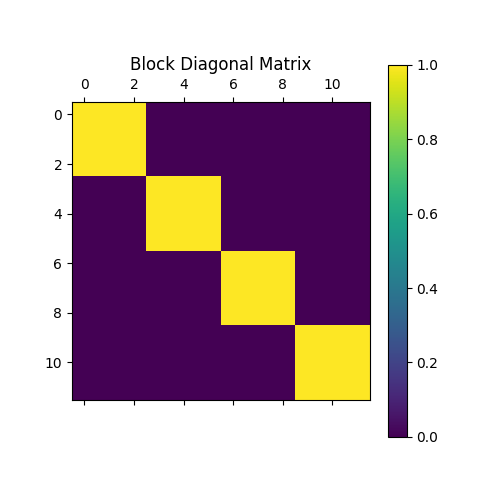
Example 4: Creating a Block Diagonal Matrix
This snippet uses the Kronecker product to create a block diagonal matrix, where each block is a matrix of ones.
import numpy as np
import matplotlib.pyplot as plt

block_size = 3
n_blocks = 4
block_eye = np.kron(np.eye(n_blocks), np.ones((block_size, block_size)))

plt.matshow(block_eye)
plt.title("Block Diagonal Matrix")
plt.colorbar()
plt.show()
Output:
That’s it. This tutorial ends here. Happy coding & have a nice day!


