The scipy.cluster.hierarchy.linkage() function is a powerful tool in the SciPy library, used primarily for hierarchical clustering. Hierarchical clustering is a type of cluster analysis that seeks to build a hierarchy of clusters. In this tutorial, we’ll dive deep into how to use the linkage() function along with practical examples ranging from basic to advanced.
Introduction to Hierarchical Clustering
Hierarchical clustering can be divided into two primary types: agglomerative (bottom-up approach) where every observation starts in its own cluster, and clusters are iteratively merged, and divisive (top-down approach) where all observations start in one cluster that is successively split. The linkage() function uses the agglomerative method.
Importing Necessary Libraries
from scipy.cluster.hierarchy import linkage, dendrogram
import matplotlib.pyplot as plt
import numpy as np
Basic Example
First, let’s start with a simple example. We will create a small dataset and apply the linkage function to it.
data = np.array([[1, 2], [2, 3], [3, 2], [4, 4]])
Z = linkage(data, 'ward')
plt.figure(figsize=(10, 7))
plt.title('Hierarchical Clustering Dendrogram')
plt.xlabel('sample index')
plt.ylabel('distance')
dendrogram(Z)
plt.show()
Output:
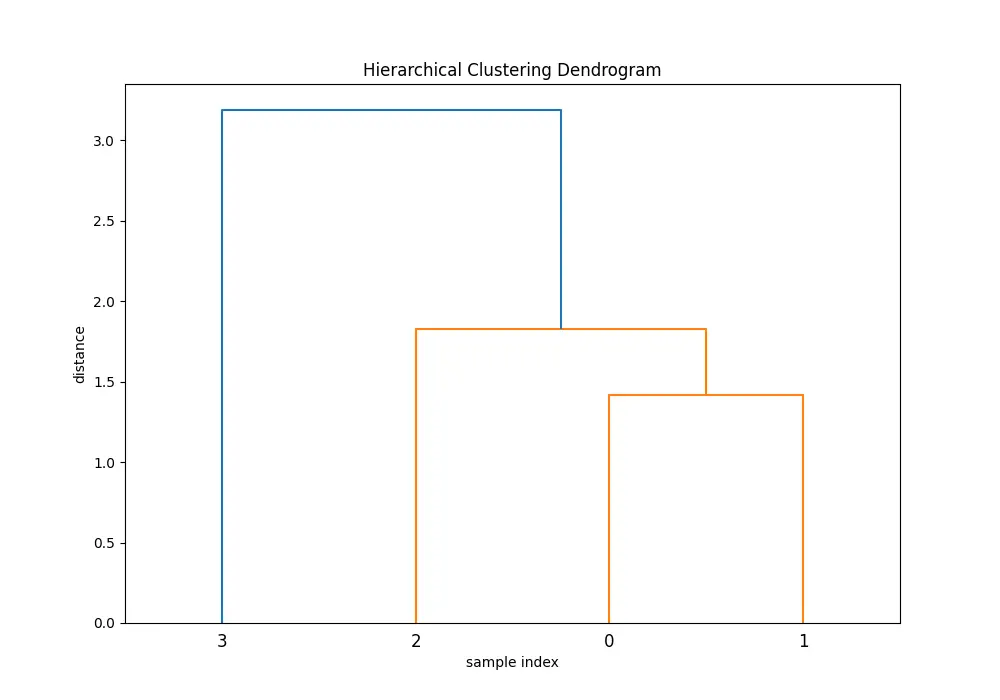
In the dendrogram produced, each step of the agglomerative clustering is represented. The ‘ward’ method minimizes the variance in each cluster as it merges them.
Understanding Parameters and Methods
The linkage() function accepts various parameters, but the most critical ones are:
- Method: This defines the criterion used for merging clusters. Common methods include ‘ward’, ‘single’, ‘complete’, ‘average’, and ‘centroid’. Each has a specific way of calculating distances between clusters, which you will see in the examples below.
- Metric: The metric parameter defines the distance metric to use when calculating distance between observations. Standard metrics include ‘euclidean’, ‘cityblock’ (manhattan), and ‘cosine’, among others.
Using Different Methods
Let’s explore how different methods affect the clustering by applying them to the same dataset.
data = np.array([[1, 2], [2, 3], [3, 2], [4, 4]])

methods = ['single', 'complete', 'average', 'centroid', 'ward']
for method in methods:
    Z = linkage(data, method)
    plt.figure(figsize=(10, 7))
    plt.title(f'Hierarchical Clustering Dendrogram ({method})')
    plt.xlabel('sample index')
    plt.ylabel('distance')
    dendrogram(Z)
    plt.show()
You’ll see 5 dendrograms:
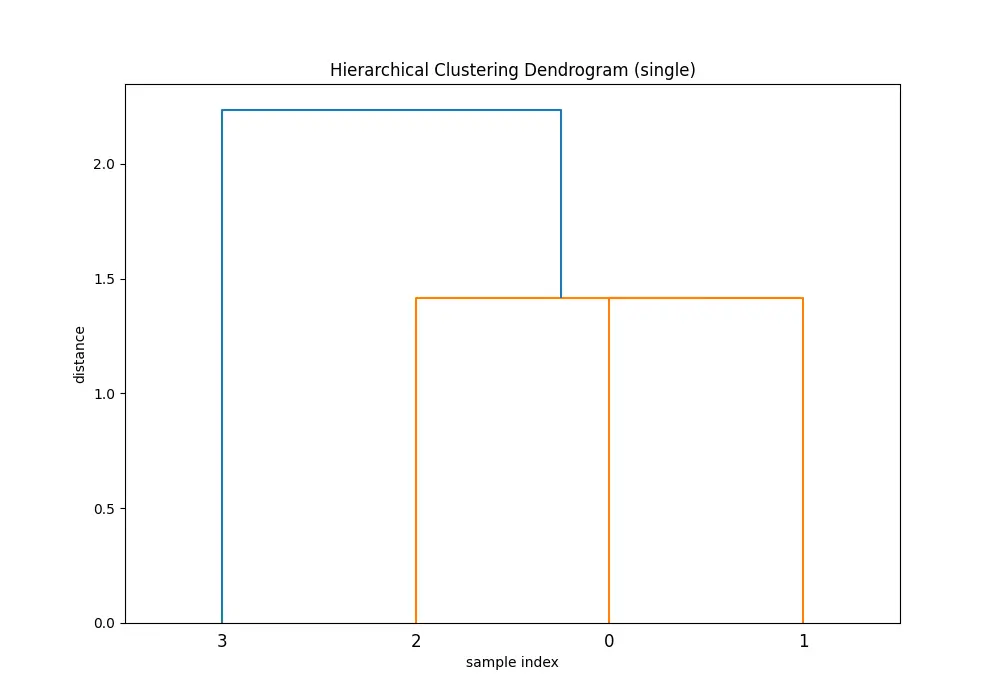
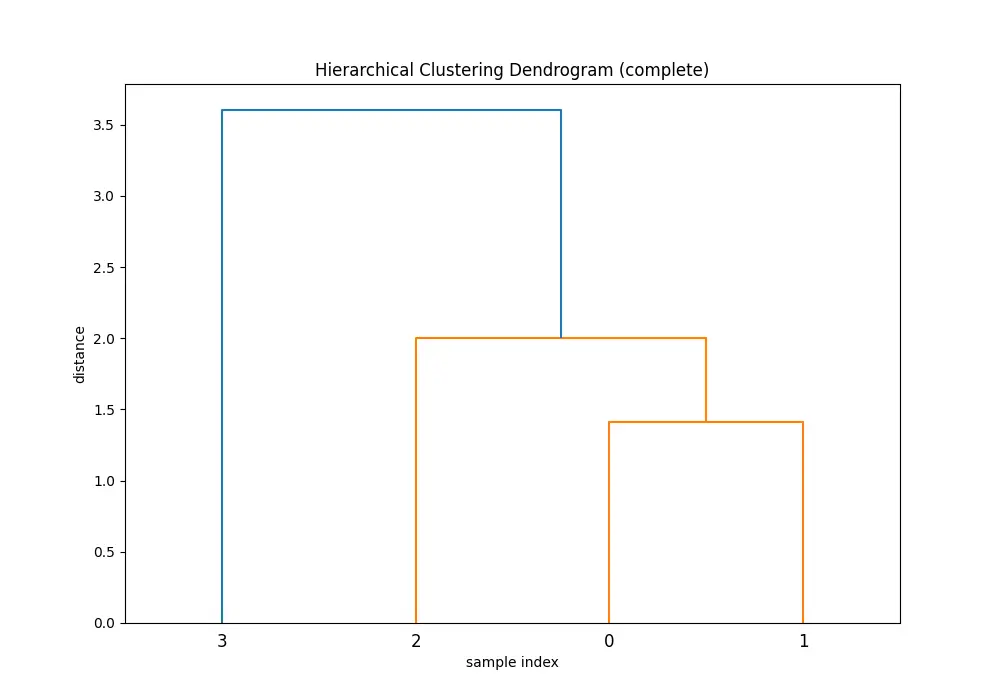
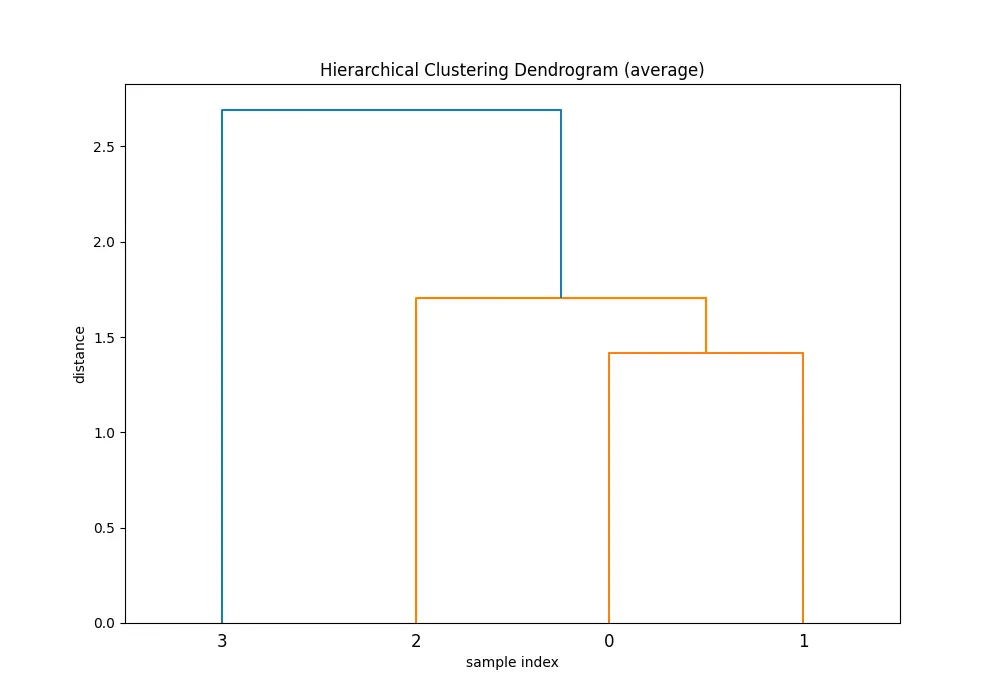
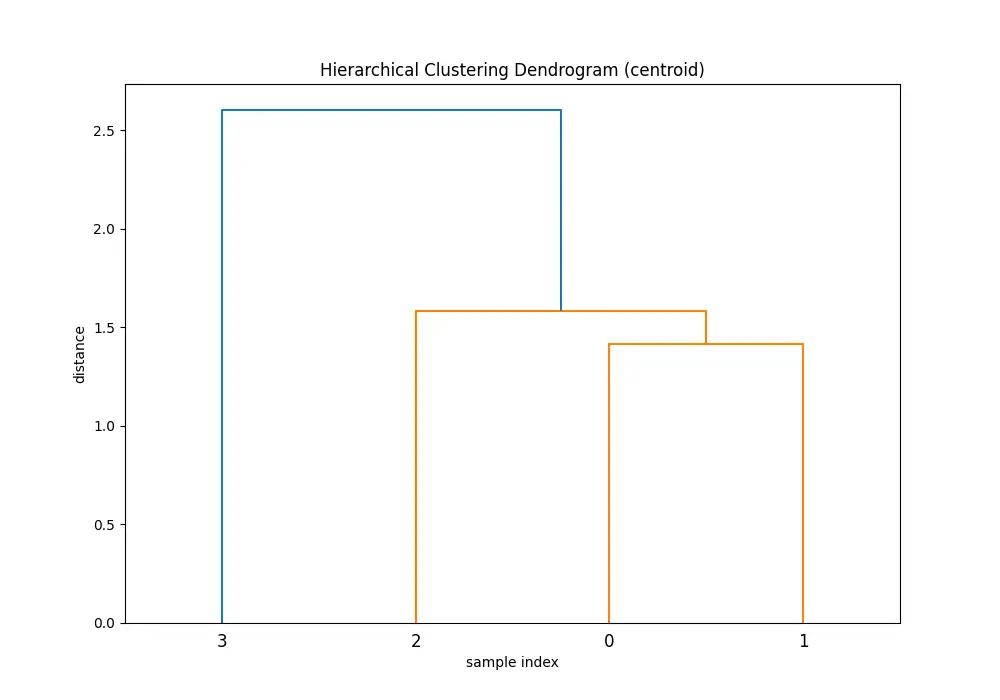
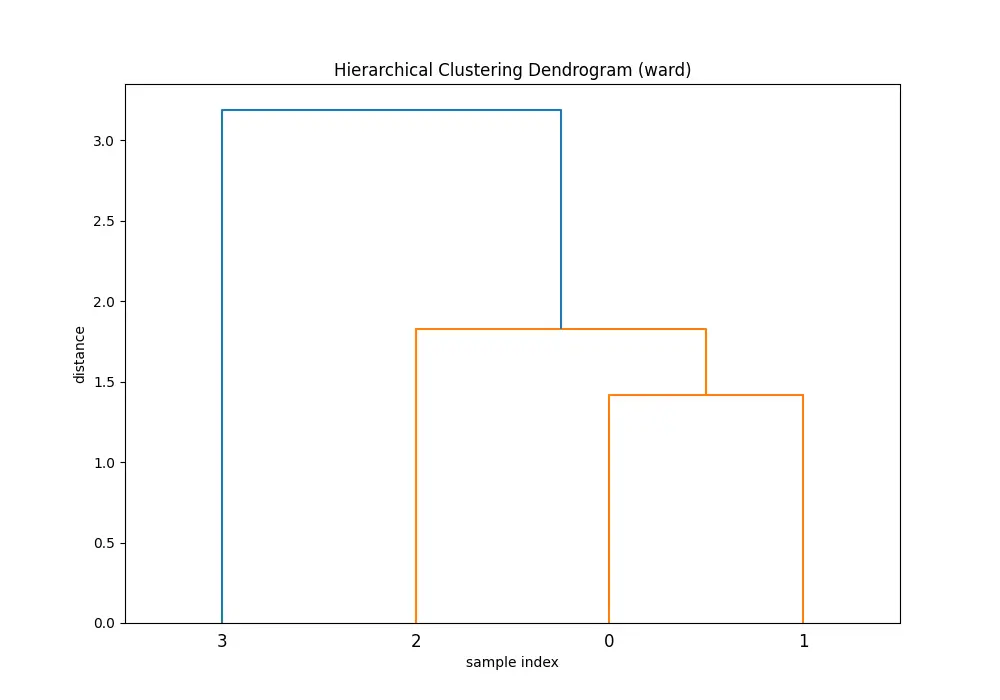
Comparing the dendrograms, ‘single’ method shows the clustering process where the closest pair of clusters is merged at each step. However, ‘ward’ method yields more balanced and informative clusters by considering the variance.
Advanced Usage: Custom Distance Metric
Moving to more advanced usage, we can use a custom distance metric instead of predefined ones. This is achieved by preprocessing the data with the desired metric and then providing the processed matrix to the linkage() function.
from scipy.spatial.distance import pdist, squareform

np.random.seed(123)

data_advanced = np.random.rand(10, 2)
dist_matrix = squareform(pdist(data_advanced, 'minkowski', p=3))
Z = linkage(dist_matrix, 'ward')
plt.figure(figsize=(10, 7))
plt.title('Hierarchical Clustering Dendrogram with Custom Metric')
plt.xlabel('sample index')
plt.ylabel('distance')
dendrogram(Z)
plt.show()
Output:
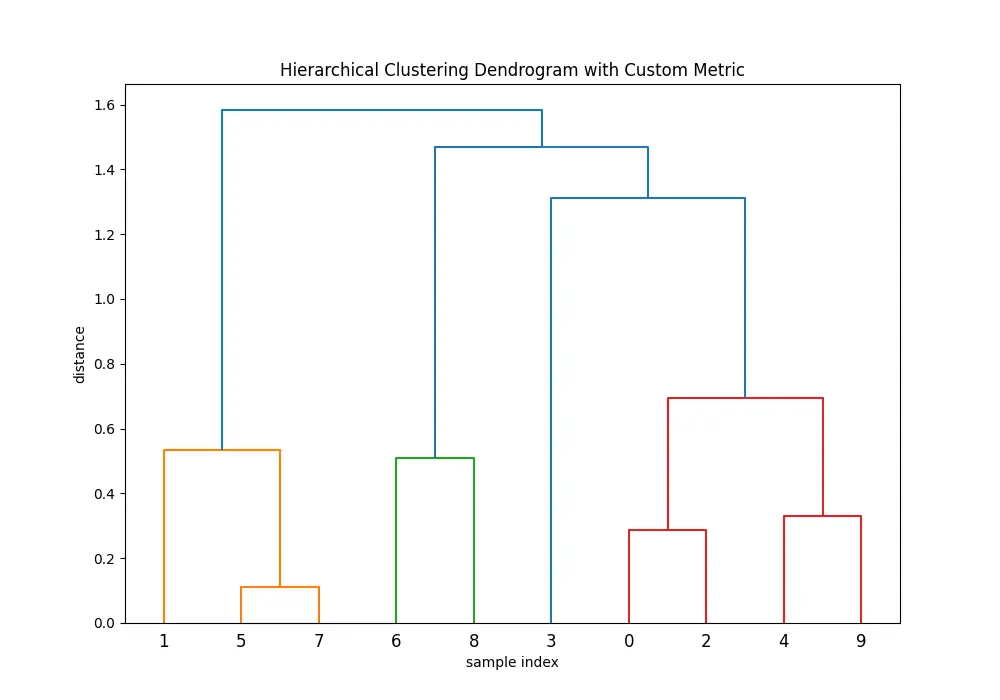
Note that when using a custom distance matrix with linkage(), you must ensure the matrix is in the condensed form or square form, as required by the function.
Combining with Other SciPy Functions
The linkage() function can be effectively combined with other functions from the SciPy library for more comprehensive analyses. For instance, using fcluster() to cut the dendrogram at a specified distance to get cluster labels:
from scipy.cluster.hierarchy import fcluster
cluster_labels = fcluster(Z, t=5, criterion='distance')
print(cluster_labels)
Conclusion
Understanding and utilizing the scipy.cluster.hierarchy.linkage() function can greatly enhance your data analysis, clustering projects. By experimenting with different methods and metrics, as well as incorporating custom distance metrics, you can adapt this powerful tool to a wide range of datasets and requirements. This tutorial provided a solid foundation, but practice with varied datasets is key to mastering hierarchical clustering.


