Introduction
In the realm of data science, Python’s NumPy library stands as a cornerstone, providing extensive capabilities for numerical computations. An intriguing part of this library is the random.Generator.vonmises() method, which is instrumental in generating random numbers from the von Mises distribution. This distribution, also known as the circular normal distribution, is vital in fields dealing with circular data, such as meteorology, geology, and phase-locked loops. This tutorial will elucidate the usage of the von Mises distribution through the lens of the random.Generator.vonmises() method, spanning five examples that progressively increase in complexity.
What is Von Mises Distribution?
Before diving into practical examples, it’s essential to understand what the von Mises distribution is and its significance. The von Mises distribution is a continuous probability distribution on the circle, and it is the analogue of the normal distribution on the line. The density function of this distribution can be used to model angles and directions, making it exceedingly useful in applications requiring the analysis of circular data.
Syntax & Parameters
Syntax:
Generator.vonmises(mu, kappa, size=None, dtype=np.float64, out=None)
Parameters:
- mu: Mean direction, expressed in radians (between −−π and π).
- kappa: Concentration parameter (≥0). A higher κ means the distribution will be more concentrated around the mean direction μ.
- size: Optional. An integer or tuple of integers, specifying the output shape. If the given shape is, for example,
(m, n, k), thenm * n * ksamples are drawn. If size isNone(default), a single value is returned. - dtype: Optional. The desired data-type for the samples. The default data type is
float64. - out: Optional. An alternative output array in which to place the result. It must have a shape that the inputs broadcast to.
Returns:
- out: Samples from the von Mises distribution. If
sizeisNone, a single float is returned. Otherwise, a NumPy array of shapesizeis returne
Example 1: Basic Usage
Our journey begins with the basics: how to generate numbers from the von Mises distribution using numpy.random.Generator.vonmises(). Let’s start simple.
import numpy as np
random_gen = np.random.default_rng()
mu, kappa = 0, 4
samples = random_gen.vonmises(mu, kappa, 1000)
print(samples[:5])
Output (random):
[-0.72854197 -0.53882894 0.03115026 0.27103613 -0.84072683]This snippet showcases the generation of 1000 samples from the von Mises distribution with a mean direction mu of 0 and a concentration parameter kappa of 4. The output displays the first five samples.
Example 2: Analysis and Visualization
Moving a step further, let’s analyze and visualize the generated data to gain deeper insights. For this purpose, we’ll utilize Matplotlib, another pillar of the Python data science ecosystem.
import matplotlib.pyplot as plt
import numpy as np

random_gen = np.random.default_rng(seed=2024)
mu, kappa = 0, 4

samples = random_gen.vonmises(mu, kappa, 1000)
plt.hist(samples, bins=50, density=True)
plt.title('von Mises Distribution Histogram')
plt.show()
Output:
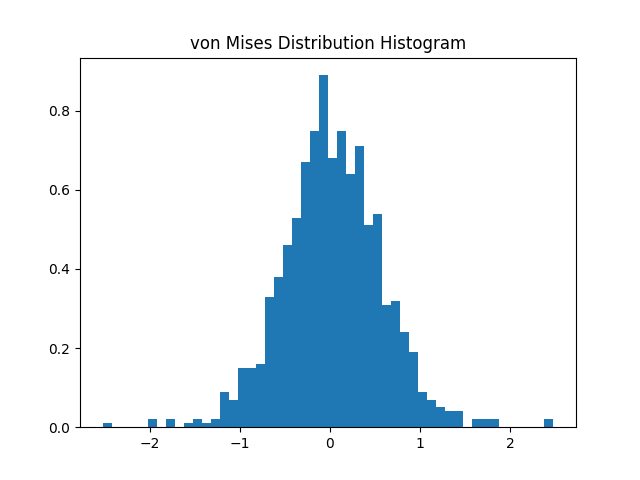
This code segment generates a histogram representing the distribution of 1000 von Mises samples. It provides a visual understanding of how the samples are distributed around the mean direction.
Example 3: Multiple Distributions Comparison
To delve deeper, let’s compare von Mises distributions with different concentration parameters. This example underscores the effect of the kappa parameter on the distribution’s shape.
import matplotlib.pyplot as plt
import numpy as np

random_gen = np.random.default_rng(seed=2024)

for k in [0.5, 2, 4]:
    samples = random_gen.vonmises(0, k, 1000)
    plt.hist(samples, bins=50, density=True, alpha=0.5, label=f'k={k}')
plt.title('Comparison of von Mises Distributions')
plt.legend()
plt.show()
Here’s the result:
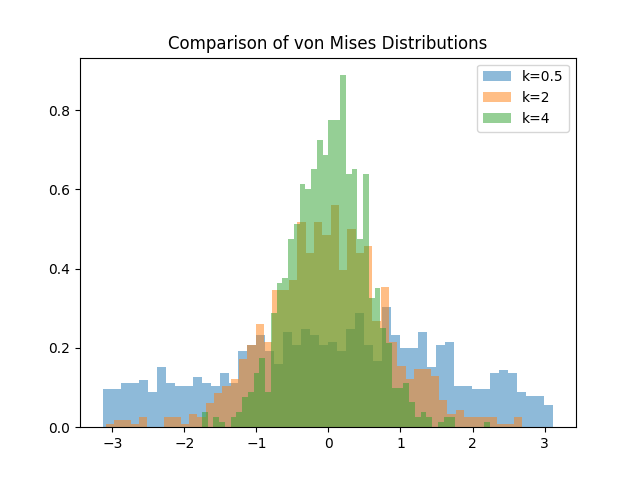
This script produces a histogram comparing three distributions with different kappa values. It visually demonstrates how a higher kappa results in a more concentrated distribution around the mean direction.
Example 4: Application in Circular Data Analysis
With a solid grasp on generating and visualizing von Mises distributions, let’s explore a practical application: circular data analysis. For this purpose, we simulate a scenario where we have angular data (e.g., wind directions) and aim to fit a von Mises distribution to this data.
import numpy as np

random_gen = np.random.default_rng(seed=2024)

from scipy.stats import vonmises
data = random_gen.vonmises(np.pi/2, 2, 1000)
kappa_est = vonmises.fit(data)[0]
print("Estimated 'kappa':", kappa_est)
Output:
Estimated 'kappa': 2.0142067362575813This example demonstrates how to estimate the kappa parameter of a von Mises distribution given a set of angular data, highlighting the method’s utility in analyzing circular data.
Example 5: Random Sampling on a Sphere
The final example illustrates an advanced use case: using the von Mises distribution to sample points randomly on the surface of a sphere. This technique is invaluable in simulations and modeling scenarios involving spherical coordinates.
import numpy as np

random_gen = np.random.default_rng(seed=2024)


def sample_on_sphere(mu, kappa, size):
    theta = random_gen.vonmises(mu, kappa, size)
    phi = random_gen.uniform(0, 2*np.pi, size)
    x = np.sin(theta) * np.cos(phi)
    y = np.sin(theta) * np.sin(phi)
    z = np.cos(theta)
    return np.column_stack((x, y, z))


samples = sample_on_sphere(0, 4, 1000)
print(samples[:5])
Output:
[[ 0.45568467 -0.58940864  0.66704493]
 [ 0.11195114  0.01551776  0.99359254]
 [-0.2800861   0.12952993  0.95119597]
 [-0.02163846 -0.64140523  0.76689706]
 [ 0.00259483  0.00253718  0.99999341]]
This function generates random points on a sphere’s surface, leveraging the von Mises distribution for the angle theta and a uniform distribution for the angle phi. It provides a practical example of the method’s broader applications.
Conclusion
Through these examples, we’ve journeyed from the basics to sophisticated applications of the random.Generator.vonmises() method in NumPy. From simple numerical generation to applications in circular data analysis and beyond, the versatility and utility of this method have been demonstrated across various scenarios. Whether you’re a data scientist, a researcher, or a Python enthusiast, harnessing the random.Generator.vonmises() method opens doors to exploring and analyzing circular data with computational efficiency and precision.


