Introduction
NumPy’s random.Generator.triangular() method is a powerful tool for generating random numbers following a triangular distribution. The triangular distribution is useful for simulations where you need random numbers that favor a central value. This tutorial will demonstrate how to use the random.Generator.triangular() method in NumPy with 5 different examples, covering a range from basic usage to more complex applications.
What is a Triangular Distribution?
Before diving into the examples, it’s key to understand what a triangular distribution is. In essence, a triangular distribution is defined by three values: the minimum value (left), the maximum value (right), and the mode (peak). Numbers generated through this distribution are most likely to cluster around the mode but can range between the minimum and maximum values.
Syntax & Parameters
The numpy.random.Generator.triangular() method generates random samples from a triangular distribution.
Syntax:
generator.triangular(left, mode, right, size=None)Where:
- left: Lower limit.
- mode: The value where the peak of the distribution occurs.
- right: Upper limit.
- size: Optional. Output shape.
Example 1: Basic Usage
import numpy as np

# Create a random generator
rng = np.random.default_rng()

# Generate a single triangular distributed number
number = rng.triangular(left=0, right=10, mode=5)
print(number)
Output might vary since it’s random:
3.197211926951125The above code generates a single number following a triangular distribution. The values of left, right, and mode delineate the boundaries of this distribution.
Example 2: Generating Multiple Numbers
import numpy as np

# Create a random generator
rng = np.random.default_rng()

# Generate 5 random numbers
numbers = rng.triangular(left=1, right=9, mode=5, size=5)
print(numbers)
Output (vary):
[7.22376143 4.95915936 8.32967032 5.95863326 1.889988 ]Here, we generated multiple numbers to showcase how simple it is to produce several values at once, using the same method.
Example 3: Application in Data Simulation
import numpy as np
from matplotlib import pyplot as plt

# Simulate data for a project's completion times

# Create a random generator
rng = np.random.default_rng(seed=2024)

estimated_times = rng.triangular(left=7, right=14, mode=10, size=1000)

# Analyze the simulated data
count, bins, ignored = plt.hist(estimated_times, bins=30, density=True)
plt.show()
Output:
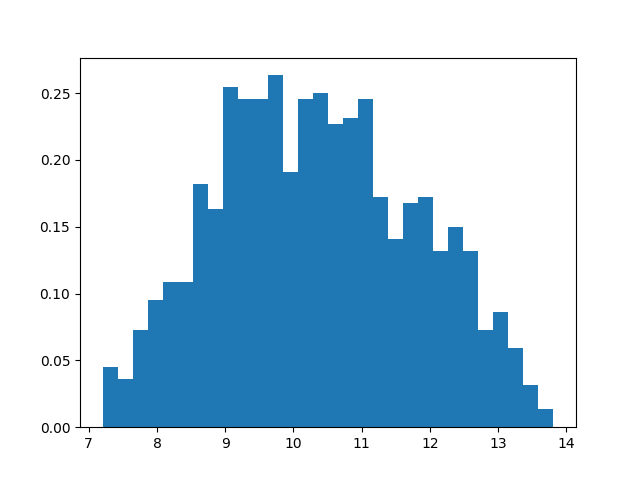
This example simulates completion times for a project, using a triangular distribution. It then visualizes the distribution of simulated times using a histogram. Through this, developers can get an understanding of likely completion times and their variability.
Example 4: Using with Other Distributions
import numpy as np
from matplotlib import pyplot as plt

# Create a random generator
rng = np.random.default_rng(seed=2024)

# Using triangular distribution to mix it with a normal distribution

dist1 = rng.triangular(left=5, right=15, mode=10, size=1000)
dist2 = rng.normal(loc=10, scale=2, size=1000)
mixed_dist = 0.5 * dist1 + 0.5 * dist2

# Analysis
count, bins, ignored = plt.hist(mixed_dist, bins=30, density=True)
plt.show()
Output:

This example demonstrates how the triangular distribution can be used in tandem with another distribution, such as the normal distribution, to model more complex scenarios or data sets.
Example 5: Advanced Data Modeling and Visualization
import numpy as np
import matplotlib.pyplot as plt

# Advanced modeling of sales data over a year

# Create a random generator
rng = np.random.default_rng(seed=2024)

monthly_sales= rng.triangular(left=50, right=150, mode=100, size=(12, 1000)) # 12 months, 1000 simulations each

# Visualization
for month in range(12):
    plt.hist(monthly_sales[month], bins=30, alpha=0.5)

plt.title('Projected Monthly Sales Distribution')
plt.xlabel('Sales')
plt.ylabel('Frequency')
plt.legend([f'Month {i+1}' for i in range(12)])
plt.show()
Output:
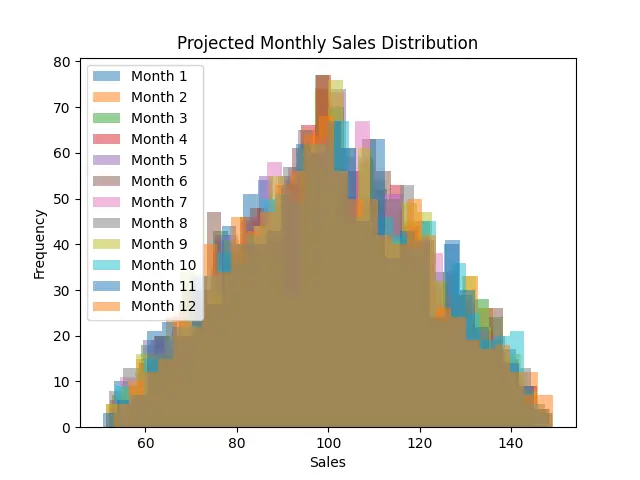
This complex example showcases how NumPy’s triangular() method can be used to model and visualize potential sales data across multiple scenarios or months, providing rich insights into how sales could fluctuate over time.
Conclusion
Throughout this guide, we’ve explored various ways to utilize the random.Generator.triangular() method in NumPy. From generating single numbers to complex data modeling and visualization, this method serves as a robust tool for simulations that require data to cluster around a peak value. With these examples, you should now feel confident integrating triangular distribution into your NumPy projects.


