Introduction
The numpy.roll() function is an incredibly useful tool in the NumPy library, allowing for the shift of elements along a specified axis. This function wraps around, meaning that elements that roll beyond the last position are re-introduced at the beginning. This capability makes numpy.roll() particularly powerful for circular data structures or periodic tasks. This tutorial explains the numpy.roll() function through 6 comprehensive examples, guiding beginners from basic applications to more advanced usage.
Understanding numpy.roll()
Before diving into examples, it’s essential to understand the function syntax: numpy.roll(a, shift, axis=None) where a is the input array, shift indicates the number of positions elements should be shifted, and axis defines the axis along which elements are shifted. If axis is omitted, the array is flattened before the shift and then restored to its original shape.
Syntax:
numpy.roll(a, shift, axis=None)Parameters:
- a: array_like. Input array.
- shift: int or tuple of ints. The number of places by which elements are shifted. If
shiftis an integer, the entire array is shifted. Ifshiftis a tuple of integers, then each element of the tuple indicates a shift along the corresponding axis. - axis: int or tuple of ints, optional. Axis or axes along which elements are shifted. By default, the array is flattened.
Returns:
- res: ndarray. Output array, with the same shape as
a.
Example 1: Basic Usage
Let’s start with the simplest form of using numpy.roll(). Suppose you have an array [1, 2, 3, 4, 5], and you want to roll it by two positions. The code and the output will look like this:
import numpy as np

arr = np.array([1, 2, 3, 4, 5])
shifted_arr = np.roll(arr, 2)
print(shifted_arr)
Output:
[4, 5, 1, 2, 3]This example illustrates how numpy.roll() cycles through the array, moving each element up by two positions and wrapping the overflow elements back to the front.
Example 2: Rolling Along a Specific Axis
In multi-dimensional arrays, specifying an axis for the roll operation can be crucial. Consider a 2D array where you want to shift all rows by one position to the right:
import numpy as np

arr = np.array([[1, 2, 3], [4, 5, 6], [7, 8, 9]])
shifted_arr = np.roll(arr, shift=1, axis=1)
print(shifted_arr)
Output:
[[3, 1, 2],
 [6, 4, 5],
 [9, 7, 8]]
This shows how one can selectively roll elements along a particular axis, in this case, horizontally across rows.
Example 3: Negative Shift
Shift values in numpy.roll() can also be negative, effectively rolling elements in the opposite direction. Let’s roll our original array by -2 positions:
import numpy as np

arr = np.array([1, 2, 3, 4, 5])
shifted_arr = np.roll(arr, -2)
print(shifted_arr)
Output:
[3, 4, 5, 1, 2]A negative shift thus moves elements to the left.
Example 4: Rolling Multiple Axes Simultaneously
For ND arrays, numpy.roll() allows for shifts along multiple axes simultaneously. Consider a 3D array where you want to shift one position along the first axis and two positions along the second axis:
import numpy as np

arr = np.array([[[1, 2], [3, 4]], [[5, 6], [7, 8]]])
shifted_arr = np.roll(arr, shift=[1, 2], axis=[0, 1])
print(shifted_arr)
Output:
[[[7, 8],
  [5, 6]],
 [[3, 4],
  [1, 2]]]
This illustrates the flexibility of numpy.roll() when working with complex data structures and requirements.
Example 5: Using numpy.roll() with Image Data
This example requires the scikit-image and matplotlib package:
pip install scikit-image matplotlibnumpy.roll() is also incredibly useful when working with image data. Rolling an image array can shift the image in different directions. For instance, shifting an image vertically down:
import numpy as np
from matplotlib import pyplot as plt
from skimage import data

# Load a sample image from skimage.data
img = data.astronaut()

# Shift the image 50 pixels down
shifted_img = np.roll(img, shift=250, axis=0)

# Plotting both the original and the shifted image side by side
plt.figure(figsize=(10, 5))  # Set the figure size to make the images larger

# Display the original image
plt.subplot(1, 2, 1)  # 1 row, 2 columns, 1st subplot
plt.imshow(img)
plt.title('Original Image')
plt.axis('off')  # Hide axis for better visualization

# Display the shifted image
plt.subplot(1, 2, 2)  # 1 row, 2 columns, 2nd subplot
plt.imshow(shifted_img)
plt.title('Shifted Image')
plt.axis('off')  # Hide axis for better visualization

plt.show()
Output:
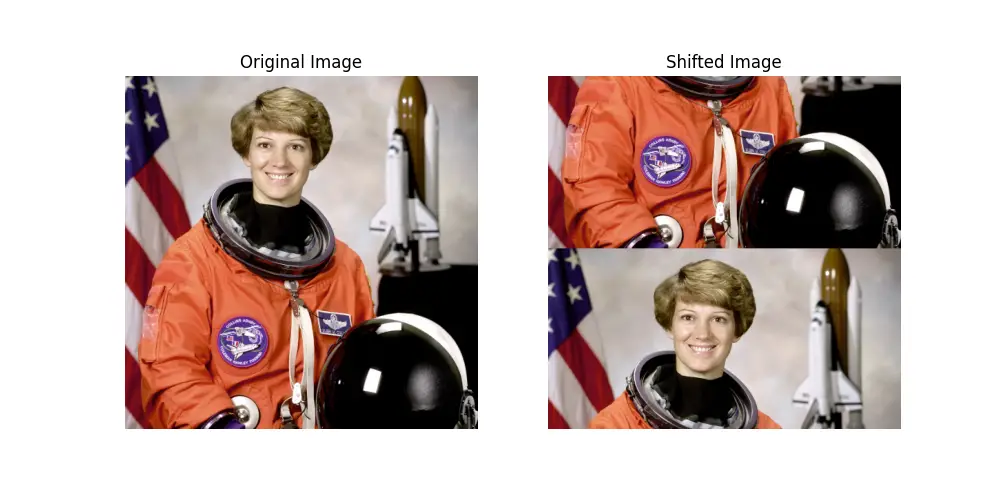
This demonstrates the potential of numpy.roll() in practical applications beyond simple arrays.
Example 6: Circular Buffer Implementation
Finally, an advanced example of using numpy.roll() is implementing a circular buffer. A circular buffer is a data structure that uses a single, fixed-size buffer as if it were connected end-to-end. This structure is especially useful in applications where data constantly streams but only the most recent data is of interest, for instance, in real-time sensor data processing.
Here’s how one might use numpy.roll() to maintain a circular buffer:
import numpy as np

buffer_size = 10
buffer = np.zeros(buffer_size)

def add_to_buffer(new_data, buffer):
    buffer = np.roll(buffer, -1)
    buffer[-1] = new_data
    return buffer

# Example usage
new_data = 5
buffer = add_to_buffer(new_data, buffer)
print("Updated buffer:", buffer)
Output:
Updated buffer: [0. 0. 0. 0. 0. 0. 0. 0. 0. 5.]This showcases an innovative use of numpy.roll() in managing and manipulating data streams efficiently.
Conclusion
Throughout this tutorial, we explored the versatility of the numpy.roll() function from basic shift operations to more sophisticated applications in image processing and data management. Whether you’re working on simple data manipulation tasks or complex image or signal processing, numpy.roll() offers a flexible and efficient means to cyclically shift data. Its simplicity and power make it an indispensable tool in the NumPy library.


