The numpy.random.Generator.logseries() method is a fascinating tool that produces logarithmically distributed samples. This method is particularly useful in scenarios where you need to model phenomena with a high occurrence rate for rare events. In this tutorial, we will explore the logseries() method in depth, walking through five progressive examples to illustrate its versatility and power.
Introduction to NumPy’s logseries() Method
Before diving into the examples, let’s understand what the logseries distribution is. In probability theory, a log-series (or logarithmic) distribution is useful for modelling the frequency of occurrence of events when the rate of occurrence is very high for the least and most frequent events. The NumPy implementation allows for the easy generation of log-series distributed numbers.
Starting with the basics, the signature for this method is:
numpy.random.Generator.logseries(p, size=None)
where p is the shape parameter (0 < p < 1), and size specifies the output shape.
Example 1: Basic Usage
Let’s begin with a simple example of generating a logseries distribution. Here, we’ll generate a single value to get a feel for the function.
import numpy as np

# Initialize generator
rng = np.random.default_rng()

# Generate a single logseries distributed number
sample = rng.logseries(0.5, size=1)
print(sample)
Output:
[1]The 0.5 is our shape parameter p. This basic usage demonstrates how to generate one sample.
Example 2: Generating Multiple Samples
Expanding on the first example, let’s generate a series of numbers using a fixed shape parameter but with a larger size argument.
import numpy as np

rng = np.random.default_rng()

sample = rng.logseries(0.5, size=10)
print(sample)
Output (vary):
[1 2 1 1 3 1 1 1 1 2]Here, we generate ten samples, which can be used to start visualizing how data points might distribute themselves in a dataset with this type of distribution.
Example 3: Histogram Visualization
With a larger set of data, it becomes beneficial to visualize the distribution. We can do this by plotting a histogram.
import numpy as np
import matplotlib.pyplot as plt

rng = np.random.default_rng()

# Generate 1000 logseries distributed numbers
sample = rng.logseries(0.5, size=1000)

# Plot histogram
plt.hist(sample, bins=range(1, 11), align='left', rwidth=0.8)
plt.xlabel('Value')
plt.ylabel('Frequency')
plt.title('Logseries Distribution')
plt.show()
Output (vary):
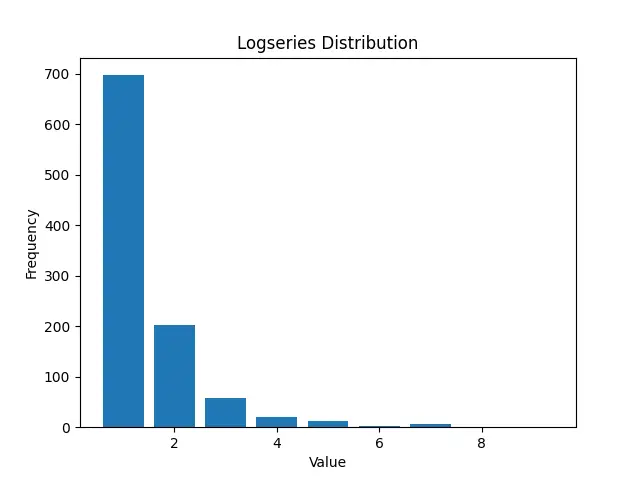
This visualization helps us see how logarithmic distribution skews towards lower values, a key characteristic of the log-series distribution.
Example 4: Changing the Shape Parameter
Next, let’s see how changing the shape parameter p affects the distribution. We’ll compare two distributions with different p values.
import numpy as np
import matplotlib.pyplot as plt

rng = np.random.default_rng()

# Generate samples with different p values
sample1 = rng.logseries(0.5, size=1000)
sample2 = rng.logseries(0.7, size=1000)

# Plot histograms
plt.hist(sample1, alpha=0.5, label='p=0.5')
plt.hist(sample2, alpha=0.5, label='p=0.7')
plt.xlabel('Value')
plt.ylabel('Frequency')
plt.title('Logseries Distribution: p Comparison')
plt.legend()
plt.show()
Output (vary):
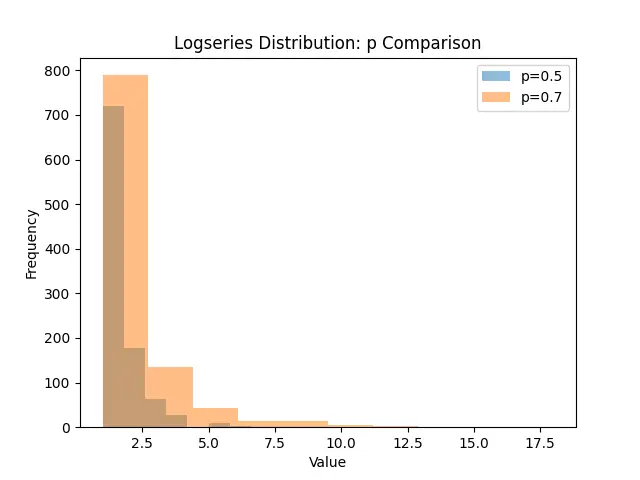
This example illustrates the impact of the shape parameter on distribution outcomes, hinting at the flexibility of the logseries() method to fit different data modeling needs.
Example 5: Generating Two-Dimensional Arrays
Lastly, let’s extend our usage of the logseries() method to generate a two-dimensional array. This is particularly useful for simulations or modeling that requires multidimensional data.
import numpy as np

rng = np.random.default_rng()

# Generate a 2D array of logseries distributed numbers
sample = rng.logseries(0.5, size=(5, 5))
print(sample)
Output (vary):
[[1 1 1 3 1]
 [2 2 1 1 1]
 [1 1 2 4 1]
 [2 3 1 2 1]
 [2 1 1 2 1]]
Here, we generate a 5×5 matrix of logseries distributed numbers. This showcases the method’s ability to generate data suiting complex modelling or simulation requirements.
Conclusion
The numpy.random.Generator.logseries() method provides a powerful way to generate numbers following a logarithmic series distribution. Through these five examples, ranging from basic to more complex applications, we’ve seen the versatility and utility of this function. It’s an indispensable tool in the numerical computing toolkit, especially for scenarios requiring modeling of skewed distributions.


